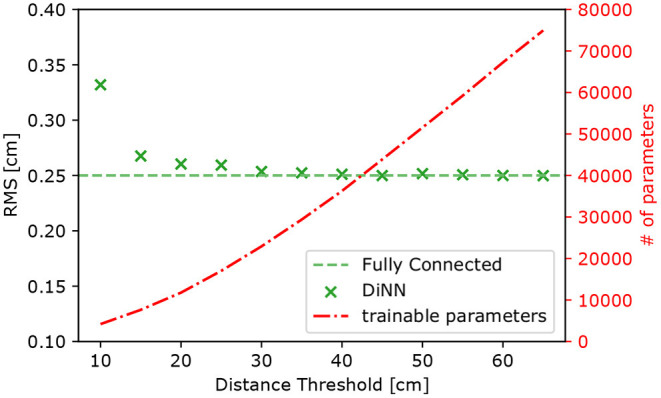
Figure 10.

The RMS of localization error (left axis) and the number of trainable parameters in the DiNN model (right axis) as functions of threshold used for the graph constrained layers in the model. The RMS decreases as the threshold increases until the threshold reaches 30 cm, but the number of parameter still increases as the threshold increases. The RMS is calculated on models' prediction of simulated 100 electron S2s and averaged over x,y dimension.
