Figure 4.
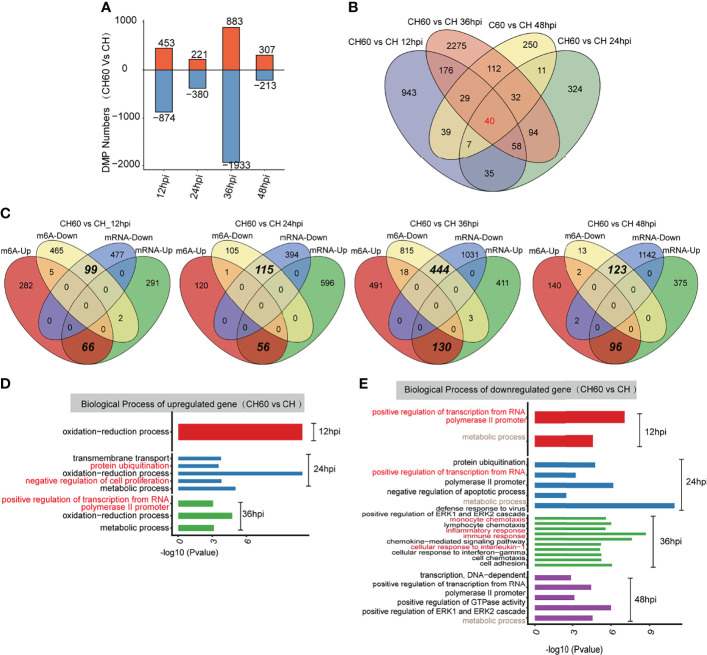
Functional analysis of coding genes with altered m6A peaks between virulent (CH) and attenuated (CH60) DHAV-1 duckling livers. (A) The number of hypermethylated (up, red colour) and hypomethylated (down, blue colour) m6A peaks between the DHAV CH60 and CH strains at 12 h, 24 h, 36 h, and 48 h postinfection with DHAV-1. (B) Venn diagrams showing the number of altered m6A peaks between DHAV CH60- and CH-stained livers at each time point. Some m6A-modified genes are further validated by qRT–PCR ( Supplementary Figures 5–7). (C) Venn diagrams showing the number and relationship of m6A peaks and mRNA expression between CH60 and CH at each time point. (D, upregulated genes and E, downregulated genes) GO biological terms of genes with altered m6A peaks and mRNA expression levels between the DHAV CH60 and CH strains at each time point.

