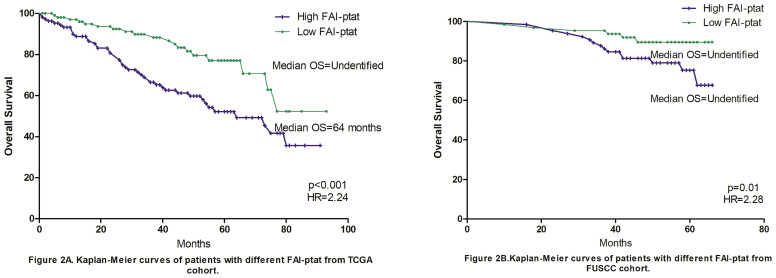
Figure 2.
Kaplan–Meier curves of patients with different FAIPTAT. Fat attenuation index (FAI) was calculated and grouped according to the median FAT value of the FUSCC and TCGA cohorts. (A) Overall survival of the TCGA cohort, the 5-year median overall survival was 64 months for high FAIPTAT group and not reached for low FAIPTAT group (HR = 2.24, p <0.001). (B) Overall survival of the FUSCC cohort, the 5-year median overall survival was not reached for both groups in FUSCC cohort (HR = 2.28, p = 0.01). The 3-year survival rate was 88%/93% for high FAIPTAT and low FAIPTAT groups in FUSCC cohort (HR = 1.81) and 72%/93% in TCGA cohort (HR = 5.65).

