Figure 3.
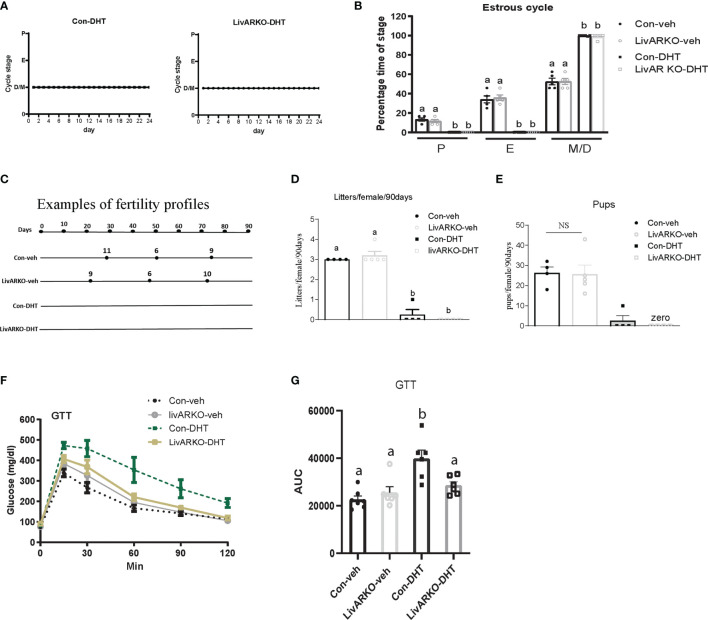
Cyclicity and fertility of mice with DHT treatment. Representative data for vaginal cytology from individual Con-DHT and LivARKO-DHT mice (A). (B) Estrous cycles. Percentage time spent in each stage of the estrous cycle was significantly differently among the four groups. Metestrus (M)/diestrus (D) was shown consistently in DHT treated mice. (C) Example of fertility profile: female mice were mated with wild type male mice for 90 days. Each line represents an individual female mouse of each group. The black dot represents the day that each litter was born after introduction to male. Number on the top of line represents how many pups in each litter. Total numbers of litters (D) and pups (E) per female were significantly reduced in DHT treated (Con-DHT and LivARKO-DHT) mice compared to vehicle treated mice during the 90 days of mating. (F) Control and LivARKO mice, with and without DHT treatment were subjected to glucose tolerance test (GTT). (G) The area under the curve (AUC) was determined for the GTT. Statistical analysis was performed using two-way ANOVA followed by Tukey’s multiple tests. Bars with different letters represent significantly different values from each other with p<0.05. Values are mean ± SEM, n = 4-7/group.

