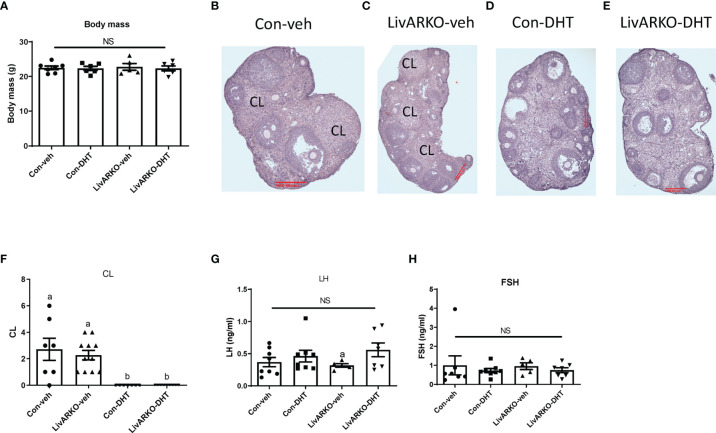
Figure 4.
Body mass, ovarian structure, and LH and FHS levels of mice with DHT treatment. (A) Body mass was recorded at 4 month old. Representative ovary structure for Con-veh (B), LivARKO-veh (C), Con-DHT (D) and LivARKO-DHT (E). (F) Corpora lutea (CL) was counted every 10th section per ovary (n=7-11 per group). LH (G) and FSH (H) levels were measured at basal (Met/Destrus) stage. There was no difference in body mas, CL, basal LH and FSH levels among groups. (F) Statistical analysis was performed using two-way ANOVA followed by Tukey’s multiple tests. Bars with different letters represent significantly different values from each other with p<0.05. Values are mean ± SEM, n = 5-11/group. NS: non-significant.

