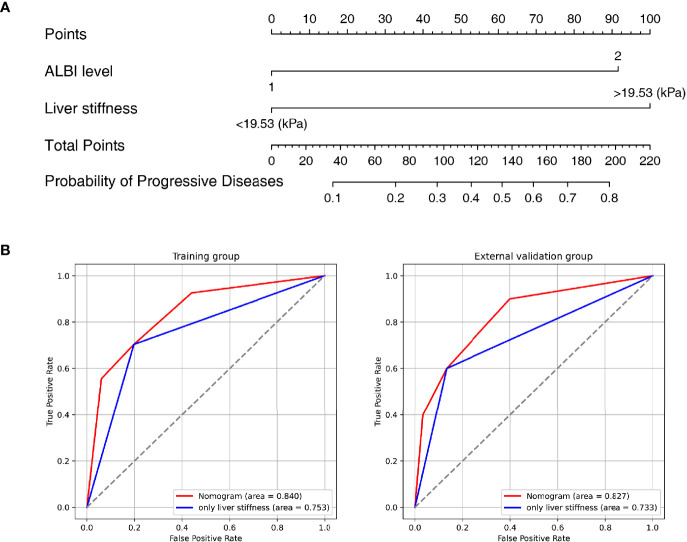
Figure 3.
Nomogram and Receiver operating characteristic (ROC) curves analysis. (A) Nomogram for predicting probability of Progressive Diseases (PD) after therapy with anti–programmed cell death protein 1 (PD-1) plus lenvatinib. (B) ROC curves for 2 models in the training (left) and validation (right) set. Model based on baseline liver stiffness (LS) values of tumorous foci >19.53 kPa were shown in blue. Nomogram contains both baseline LS of tumorous foci and ALBI grade were shown in red.

