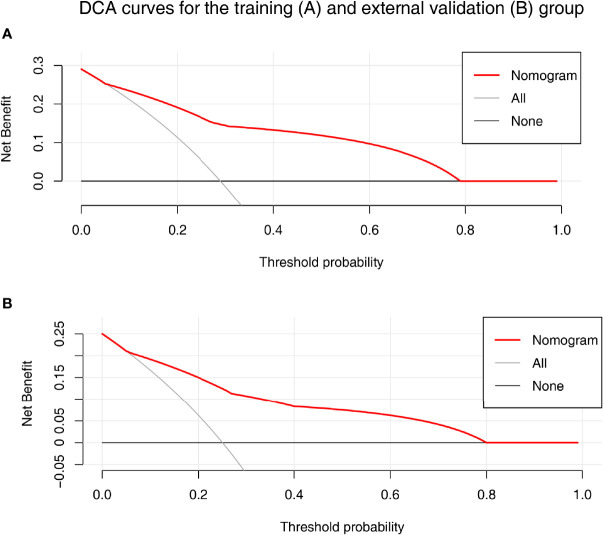
Figure 5.
The decision curve analysis (DCA) for the nomogram in training (A) and validation (B) set. Nomogram contains both baseline LS of tumorous foci and ALBI grade were shown in red. Result showed that using the nomogram for PD prediction has more benefit than the treat-all-patients scheme (gray curve). A larger area under the decision curve suggested a better clinical utility.

