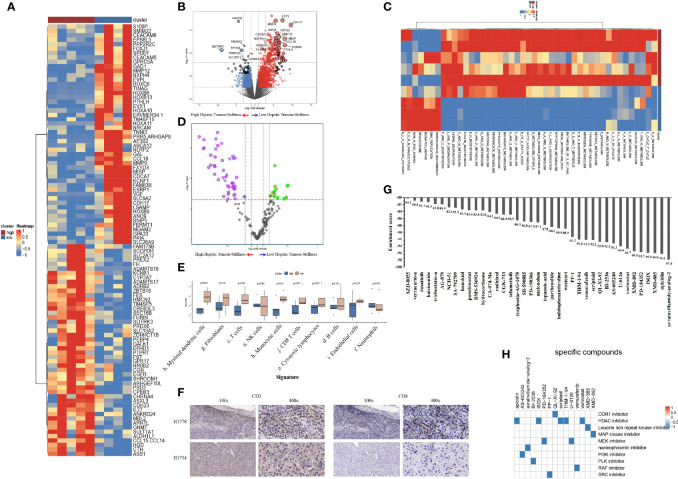
Figure 6.
Biological functions and immune characteristics of tumors with high (n = 5) or low (n = 4) stiffness. (A, B) Heatmap (A) and volcano plot (B) comparing differences in gene expression between tumors with high and low stiffness. (C, D) Heatmap (C) and volcano plot (D) comparing differences in Kyoto Encyclopedia of Genes and Genomes (KEGG) pathways between tumors with high and low stiffness. (E) Boxplots of cell infiltration levels calculated by the Microenvironment Cell Populations-counter among tumors with high and low stiffness. (F) Representative micrographs of CD3 and CD8 protein expression in tumor samples with high and low stiffness, as detected by immunohistochemistry (H1778 was a patient with low stiffness liver tumor, and H1754 was a patient with high stiffness liver tumor). (G) Bar plot showing the enrichment score of each candidate compound in the connectivity map analysis. Compounds are sorted from right to left as the highest to lowest enriched, as assessed using an enrichment analysis. (H) Heatmap showing the mechanisms of the action (rows) of each compound (columns) from the connectivity map analysis. A total of 15 candidate drugs with absolute connectivity scores of <−90 were identified. Among them, 5 were histone deacetylase (HDAC) inhibitors.

