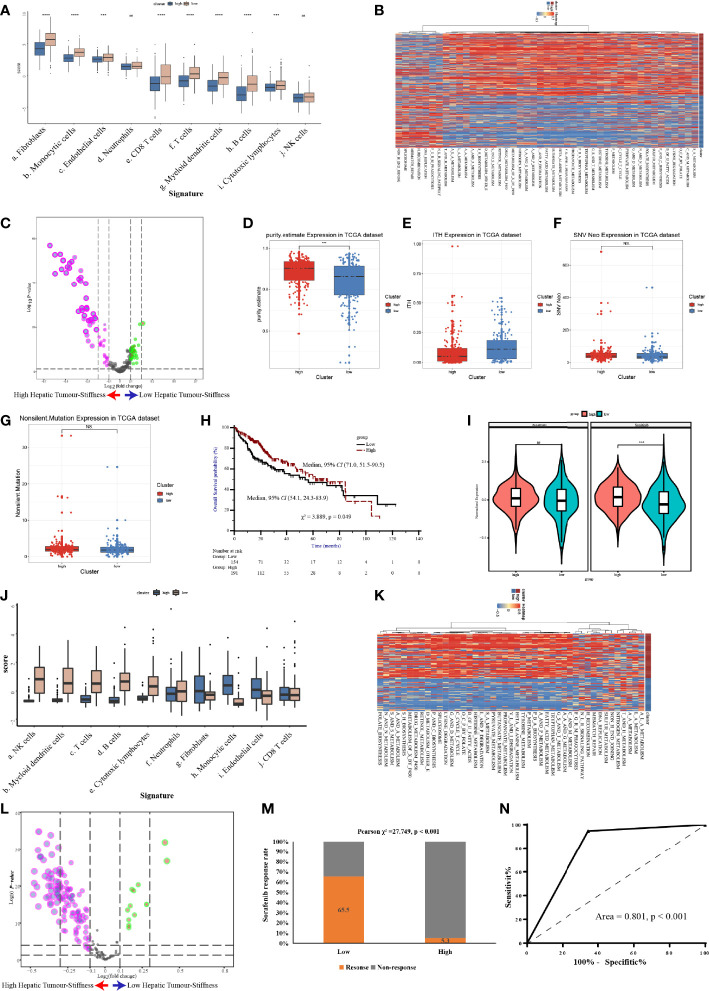
Figure 7.
Validation of the high stiffness signature in TCGA-LIHC and GSE109211 datasets. (A) Boxplots of cell infiltration, as calculated by the Microenvironment Cell Populations-counter (MCP-counter), among tumors with high and low stiffness from The Cancer Genome Atlas Liver Hepatocellular Carcinoma (TCGA-LIHC) cohort. (B, C) Heatmap (B) and volcano plot (C) comparing differences in the Kyoto Encyclopedia of Genes and Genomes (KEGG) pathways between tumors with high and low stiffness in the TCGA-LIHC cohort. (D–G) Boxplots of tumor purity (D), intratumoral heterogeneity (ITH) (E), neoantigen (F), and tumor mutation burden (G) in the 4 studied histone modification patterns of the TCGA-LIHC cohort. (H) Kaplan-Meier curves of overall survival in the TCGA-LIHC cohort according to tumor stiffness. (I) Violin plot of the estimated IC50 value of sorafenib and sunitinib calculated based on the Genomics of Drug Sensitivity in Cancer database among tumors with high or low stiffness in the TCGA-LIHC cohort. (J) Boxplots of cell infiltration levels calculated by the MCP-counter among tumors with high and low stiffness in the GSE109211 cohort. (K, L) Heatmap (K) and volcano plot (L) comparing differences in KEGG pathways between tumors with high and low stiffness in the GSE109211 cohort. (M) Bar charts summarizing the proportions of patients with different sorafenib responses across different tumor stiffness groups in the GSE109211 cohort. (N) Receiver operating characteristic curves of treatment response predictions of sorafenib according to the tumor stiffness signature in the GSE109211 cohort. NS means not-siginificant (without statistical difference); *** means p value < 0.001; **** means p value < 0.0001.

