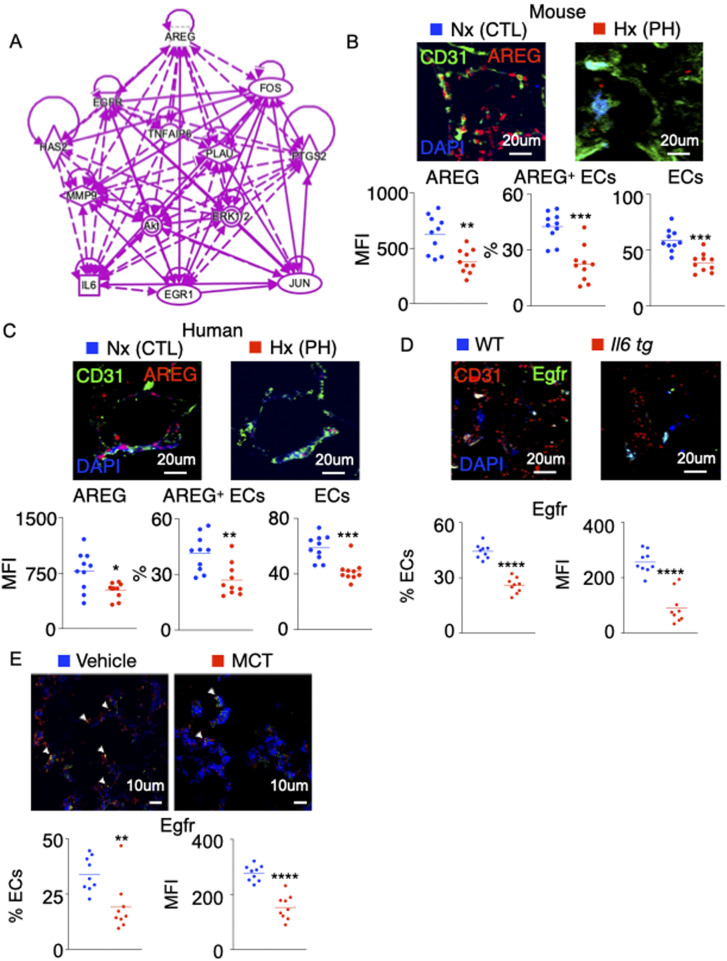
Figure S1. Egfr expression is decreased in mouse and rat models of pulmonary hypertension.
(A) Schematic representing genes downstream to AREG determined using the Ingenuity Pathway Analysis Software. The solid and dotted arrows represent either direct or indirect activations, respectively. (B, C) AREG expression was evaluated in pulmonary ECs of hypoxic mice (B) and pulmonary hypertension patients (C) by confocal imaging. (D, E) Egfr-expressing ECs and Egfr MFI were assessed in lung ECs of Il6tg mice housed in hypoxic conditions (D) and monocrotaline-injected rats (E) by confocal microscopy. n = 10 replicates per condition. Data are shown as mean. **P < 0.01, ***P < 0.001, ****P < 0.0001.

