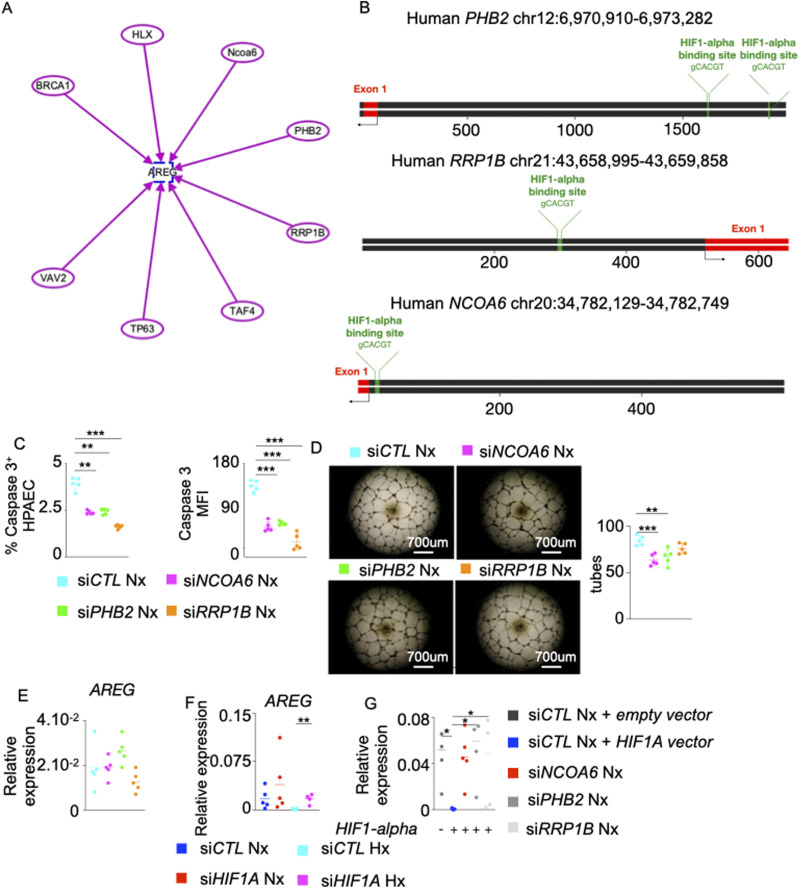
Figure S6. AREG suppression by NCOA6, PHB2 and RRP1B is HIF-1⍺-mediated.
,(A) Schematic representing AREG and its upstream genes including BRCA1, HLX, NCOA6, PHB2, RRP1B, TAF4, TP63, and VAV2 was generated using the Ingenuity Pathway Analysis Software. Each arrow represents the activation of AREG by each gene. (B) Schematic depicting HIF-1⍺–binding sites in PHB2, RRP1B, and NCOA6 gene promoter regions. This schematic was designed using UCSC Genome Browser website (https://genome.ucsc.edu) and Snapgene software (https://www.snapgene.com). (C, D, E) Pulmonary arterial endothelial cells (PAECs) were transfected with scrambled siRNA (siCTL) or siRNA against NCOA6 (siNCOA6), PHB2 (siPHB2) or RRP1B (siRRP1B) and placed in normoxia for 24 h. (C) Apoptotic PAECs were quantified by measuring caspase 3+ cells and caspase 3 MFI by flow cytometry. (D) PAECs were plated on Matrigel, and tube formation was assessed. (E) AREG expression was assessed by qPCR. (F) Human PAECs were transfected with either scrambled siRNA (siCTL), or siRNA against HIF1A and placed in normoxic or hypoxic conditions for 24 h. AREG expression was quantified by qPCR. (G) Human PAECs were transfected with a lentivirus overexpressing HIF1-A for 48 h. The cells were transfected with siRNA against NCOA6, PHB2, or RRP1B and cultured in normoxic conditions for 48 h. AREG expression was assessed by qPCR. n = 5 replicates per condition. Data are shown as mean. *P < 0.05, **P < 0.01, ***P < 0.005.

