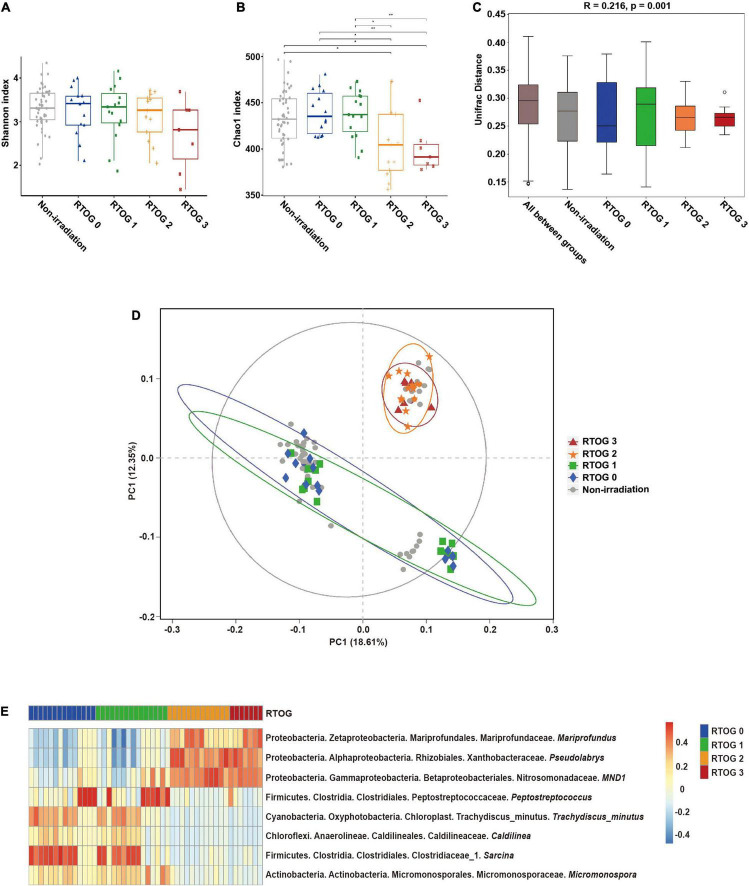
FIGURE 1.
Relationship of ARIE severity with fecal microbial community structure of samples collected at “middle” of the radiotherapy regimen. (A,B) Alpha diversity indexes (Shannon and Chao1) of the non-irradiation (gray), RTOG 0 (blue), RTOG 1 (green), RTOG 2 (orange), and RTOG 3 (red) groups. A larger index indicates greater community diversity. (C) Box plot of inter-group and intra-group Unifrac distance-based ANOSIM. R-value > 0 indicated that the inter-group difference was greater than the intra-group difference. (D) PCoA of microbial community structure in the non-irradiation group and each RTOG group. Each sample is represented by a symbol, and symbols with different colors and shapes correspond to different groups. (E) Spearman correlation heatmap of the relationship of ARIE severity (RTOG grade) with the relative abundance of eight bacterial genera (| r| ≥ 0.5, p < 0.05), in which the relative abundance of each genus was converted to a log10 value, indicated by a color gradient. *P < 0.05; **P < 0.01.

