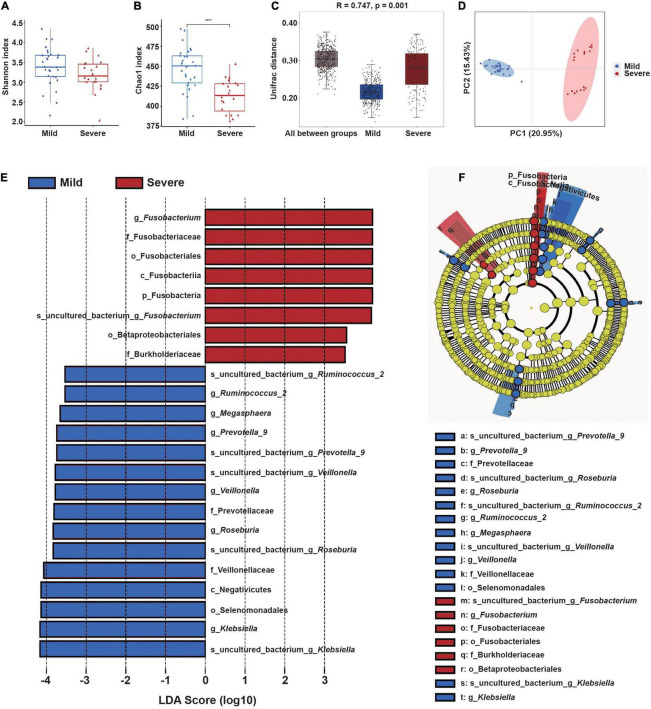
FIGURE 3.
Gut microbial community structure before radiotherapy (“start”) in patients who subsequently experienced mild or severe ARIE. (A,B) Alpha-diversity indexes (Shannon and Chao1) of the mild (blue) and severe (red) subgroups. (C) Box plot of inter-group and intra-group Unifrac distance-based ANOSIM. R-value > 0 indicated the inter-group difference was greater than the intra-group difference. (D) PCoA of Unifrac distance of the mild and severe subgroups. (E,F) LEfSe analysis (LDA significance threshold > 3.5) of taxa with the greatest differences in abundance between the severe (red, positive scores) and mild (blue, negative scores) subgroups. ****P < 0.0001.

