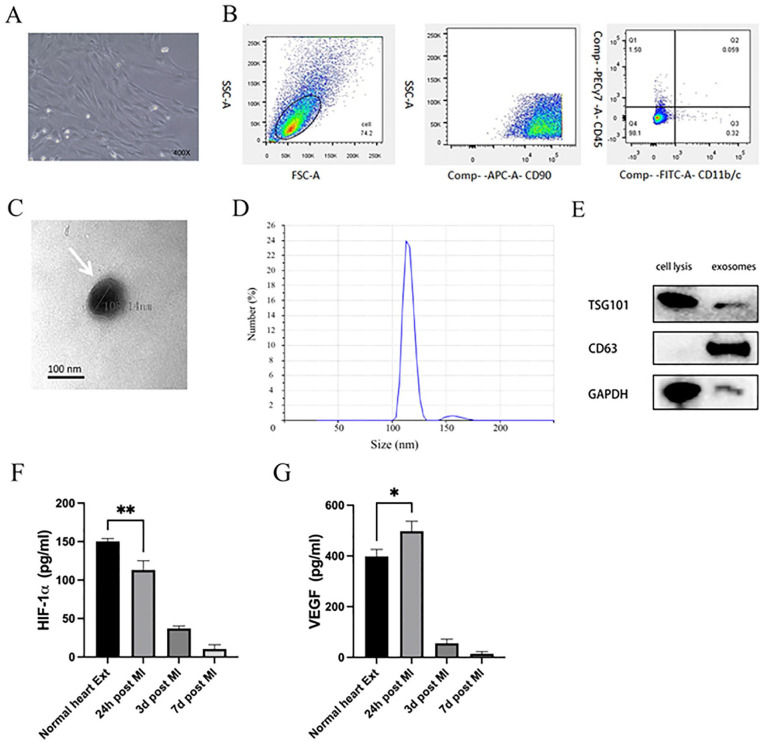
Figure 1.
MSC, MSC-Exo, and heart tissue extract characterization. (A) MSCs exhibited spindle-like morphology. (B) When assessed by flow cytometry, 98.1% of cells were positive for CD90, but negative for CD11b/c and CD45. (C) MSC-Exos (white arrows) were assessed via transmission electron microscopy. Scale bar: 100 nm. (D) Measurement by a qNano nanopore-based exosome detection system showed the percentage population of MSC-generated exosome-enriched particles by counts with two peaks (113.2 and 159.3 nm). (E) Western blotting analysis of MSC-Exo samples assessing the levels of the exosomal surface proteins TSG101 and CD63. VEGF (F) and HIF-1α (G) protein levels were measured via ELISA in rat heart tissue extracts collected from normal rats or at 24 h, 3 days, or 7 days post-MI modeling. VEGF levels were significantly increased at 24 h post-MI induction and HIF-1α levels decreased in a time-dependent manner relative to normal extracts. *P < 0.05; **P < 0.01 versus normal heart extract group. MSC: mesenchymal stem cell; MSC-Exo: mesenchymal stem cell–derived exosomes; HIF-1α: hypoxia inducible factor–1α; ELISA: enzyme-linked immunosorbent assay; MI: myocardial infarction; VEGF: vascular endothelial growth factor; SSC-A: side scattering signal area; FSC-A: forward scattering signal area; APC-A: allophycocyanin area; FITC-A: fluorescein 5-isothiocyanat area; GAPDH: glyceraldehyde-3-phosphate dehydrogenase.

