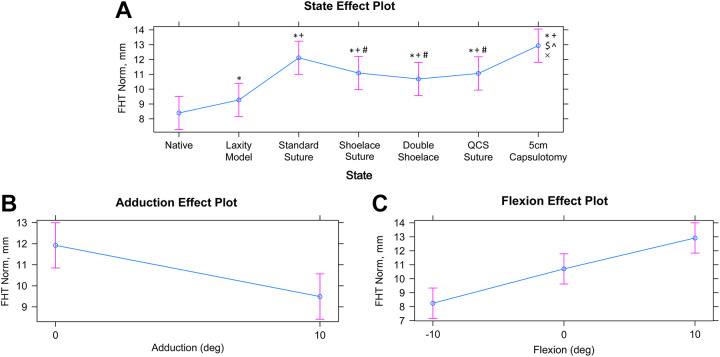
Appendix Figure A1.
Modeled independent effect plots for 3-factor linear mixed effects models of FHT norm in millimeters. Effect plots: (A) state, (B) adduction, and (C) flexion. Dots represent model estimates for each state when adduction and flexion effects are averaged. Error bars represent 95% CIs for the estimate. *Significant from native. +Significant from laxity. #Significant from standard. $Significant from shoelace. ^Significant from double shoelace. ×Significant from QCS. FHT, femoral head translation; QCS, Quebec City slider.

