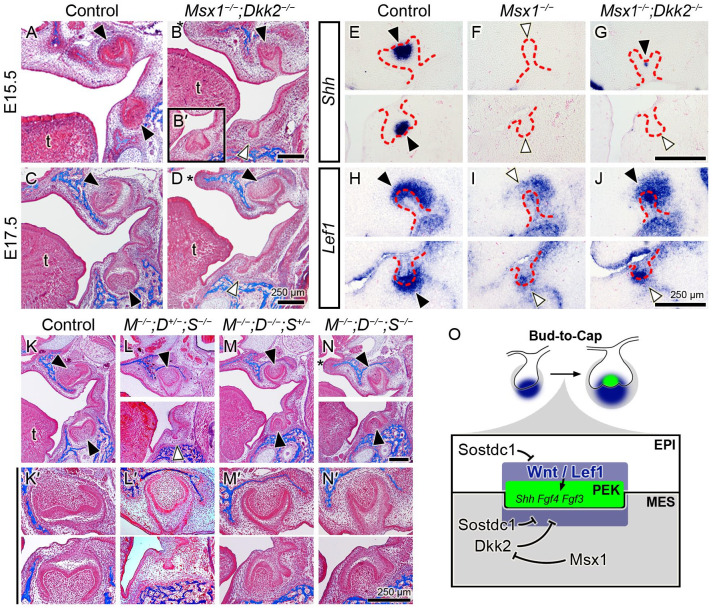
Figure 4.
Compound deletion of Dkk2 and Sostdc1 rescues tooth development in Msx1−/− maxillary and mandibular molars. (A–D) Trichrome-stained mouse embryo heads from control and Msx1−/−;Dkk2−/− groups, shown in frontal sections through the molar tooth germs at embryonic days 15.5 (E15.5) and E17.5. (B, D) Deletion of Dkk2 partially rescues tooth development in the Msx1−/− maxillary molar. (B′) Inset in panel B is from a different embryo, showing a rare case of rescue in the mandibular molar. (E–J) Molecular marker assay in control, Msx1−/−, and Msx1−/−;Dkk2−/− tooth development. (E–G) Primary enamel knot (PEK) marker Shh at the early cap stage (at E14.25). (H–J) Wnt signaling marker Lef1 at bud-to-cap transition (at E14.0). Trichrome-stained frontal sections of embryo heads (K–N) and high magnification of their molar tooth germs (K′–N′) at E18.5. M, D, and S stand for Msx1, Dkk2, and Sostdc1. In each panel, the left side is palatal/lingual and the right side is buccal. In panels A–D and K–N, the black arrowhead indicates morphogenesis beyond the bud-to-cap transition, and the white arrow indicates bud-stage arrest. In panels E–J, the distal end of the tooth germ is marked with an arrowhead: black, stronger mRNA expression within the 3 genotypes; white, weaker. Red dashed lines mark the boundary between the dental epithelium and mesenchyme. A white horizontal line in panels E–J, L, N, and K′–N′ divides the maxilla and mandible, imaged from distinct sections from the same embryo. Asterisk in panels B, D, and N marks cleft palate. t, tongue. Scale bar, 250 µm. n = 5, 2, 3, 1 for panels A–D; n = 4 for panels E–G; n = 6 for panels H–J; n = 4, 2, 3, 2 for panels K–N. (O) Schematic diagram illustrating the deduced molecular regulatory network involving Msx1, Dkk2, Sostdc1, and Wnt signaling/Lef1 at the bud-to-cap transition.

