Figure 3.
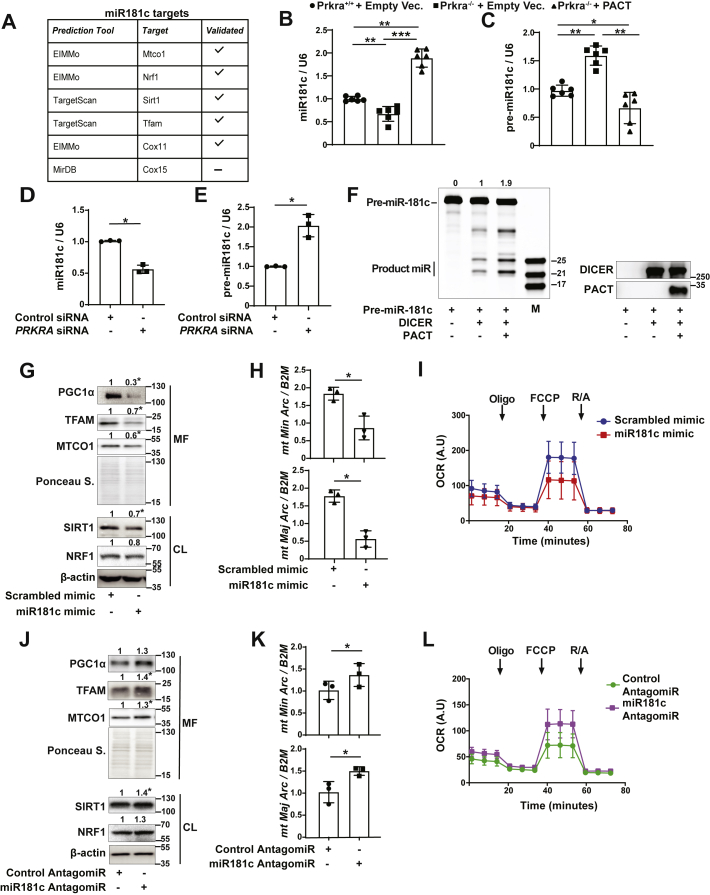
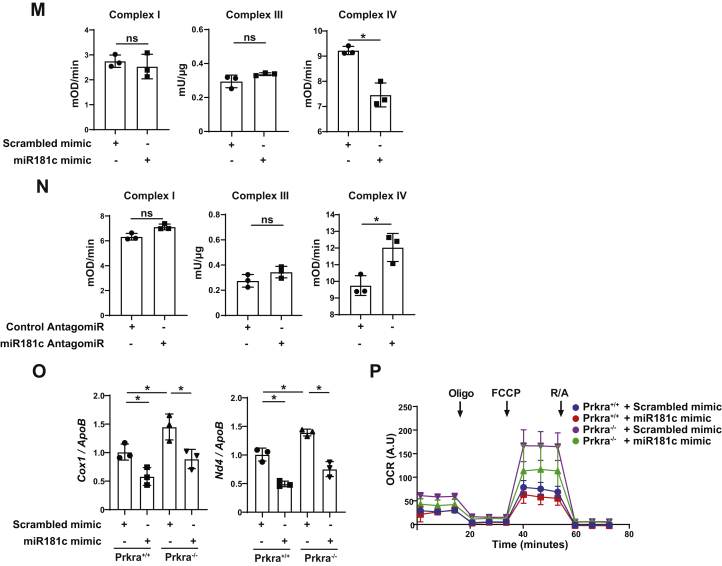
PACT suppresses mitobiogenesis through mature miR-181c.A, list of mitochondrial targets of miR-181. B and C, Prkra +/+ or Prkra −/− MEFs were transfected with empty vector (Empty Vec.) or FLAG-PACT and total RNA extracts were analyzed by qRT-PCR to determine (B) miR-181c and U6 small nuclear RNA (U6) (n = 6) and (C) pre-miR-181c and U6 RNA expression (n = 6). D and E, HEK293T cells were transfected with scrambled or PRKRA siRNA and total RNA extracts were analyzed by qRT-PCR for (D) miR-181c and U6 RNA and (E) pre-miR-181c and U6 RNA expression (n = 3). F, left panel, DICER cleavage assay performed using synthetic pre-miR-181c (10 μM) as substrate with recombinant DICER or PACT (0.2 μg) at 37 °C for 4 h. Samples are separated in 15% Urea-PAGE and detected with SYBR gold staining. M indicates microRNA marker. The average band intensities for the mature miR product are indicated at the top of the gel. Right panel, 5 ml of same samples (in the left panel) were analyzed by Western blotting using specific antibodies for DICER and PACT (n = 3). G–I, HEK293T cells were transfected with scrambled or miR-181c mimic (100 nM) (n = 3); (G) Mitochondria enriched fraction (MF) and total cell lysates (CL) proteins were analyzed by Western blotting using specific antibodies for PGC1α, TFAM, antibody cocktail against ETC proteins, SIRT1, NRF1, and β-actin. H, total genomic DNA was analyzed by qRT-PCR to determine mtDNA (mitochondrial major and minor arc): nucDNA (B2M) ratio (n = 3). I, mitochondrial respiration was analyzed by OCR. Arrows indicate time for drug injections (n = 5; data were normalized to mitochondrial mass quantified from total OXPHOS protein levels from same samples and represented as arbitrary units (A.U)). J–L, HEK293T cells were transfected with control or miR-181c AntagomiR (100 nM). J, MF and CL protein lysates were analyzed by Western blotting using specific antibodies for PGC1α, TFAM, antibody cocktail against ETC proteins, SIRT1, NRF1, and β-actin (n = 3). K, total genomic DNA was analyzed by qRT-PCR to determine mtDNA (mitochondrial major and minor arc): nucDNA (B2M) ratio (n = 3). L, mitochondrial respiration was analyzed by OCR. Arrows indicate time for drug injections (n = 5; data were normalized to mitochondrial mass quantified from total OXPHOS protein levels from same samples and represented as arbitrary units (A.U)). M, MEF cells were transfected with scrambled or miR-181c mimic (100 nM) and complex I (mOD/min), III (Units/μg), and IV (mOD/min) activity was measured by ELISA (n = 3). N, MEF cells were transfected with control or miR-181c AntagomiR (100 nM) and complex I (mOD/min), III (Units/μg), and IV (mOD/min) activity was measured by ELISA (n = 3). O and P, Prkra +/+ or Prkra−/− MEF cells transfected with scrambled or miR-181c mimic (100 nM). O, total genomic DNA was analyzed by qRT-PCR for mtDNA (mitochondrial Cox1 or Nd4): nucDNA (nuclear ApoB) ratio (n = 3). P, mitochondrial respiration was analyzed by OCR. Arrows indicate time for drug injections (n = 5; data were normalized to mitochondrial mass that was quantified from total OXPHOS protein levels from the same samples and represented as arbitrary units (A.U)). Protein expression was calculated relative to β-actin for whole cell lysate and Ponceau S. for mitochondrial fraction and depicted at the top of each blot. Data are mean ± SD. Unpaired t test with Welch’s correction or one-way ANOVA. ∗p ≤ 0.05, ∗∗p ≤ 0.01, ∗∗∗p ≤ 0.001, ns: not significant. CL, cell lysate; Cyto, cytoplasmic fraction; ETC, electron transfer chain; MEF, mouse embryonic fibroblast; MF, mitochondrial fraction; mtDNA, mitochondrial DNA; nucDNA, nuclear DNA; OCR, oxygen consumption rate; siRNA, silencer RNA.


