
Figure 1.
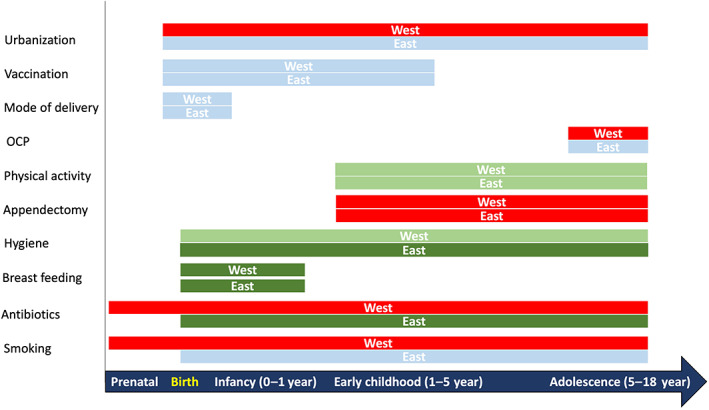
Comparison of association between environmental risk factors and risk of Crohn's disease in East and West. The bars in green indicate a protective effect, those in red indicate a positive association, and those in blue indicate no association. The intensity of color indicates the strength of association. The distance from the vertical axis represents the association of factors at various time points. These inferences have been derived from recent meta‐analyses. 1 , 2 , 3 OCP, oral contraceptive pill.