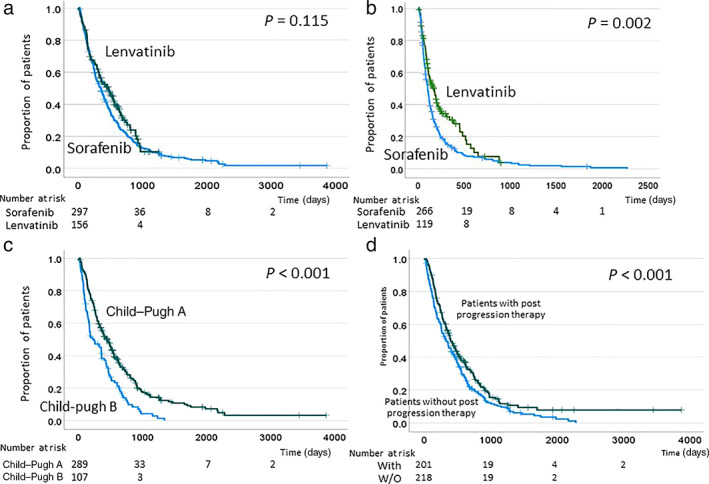
Figure 1.

Kaplan–Meier plots of (a) overall survival and (b) progression‐free survival according to treatment with sorafenib and lenvatinib. Kaplan–Meier plot of (c) overall survival according to the Child–Pugh grade and (d) use of post‐progression therapy. With: patients who received post‐progression therapy; W/O: patients who did not receive post‐progression therapy.
