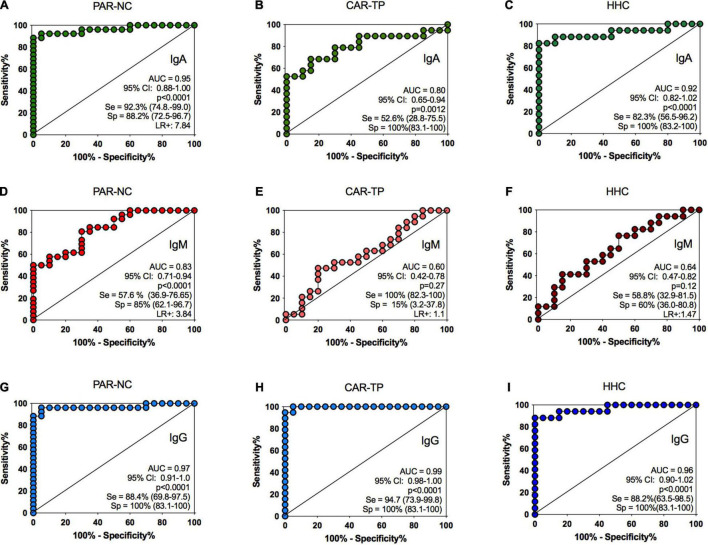
FIGURE 2.
ELISA performance of anti-Mce1A antibody levels. Receiver operating characteristic analysis for comparison of IgA anti-Mce1A (A–C), IgM anti-Mce1A (D–F), and IgG anti-Mce1A (G–I) between HD patients and HHC vs. endemic controls. PAR-NC new cases of HD in Parnaíba (n = 26); CAR-TP patients treated in Colony Carpina (n = 19); HHC household contacts of HD patients in Parnaíba (n = 17). AUC, area under the curve; CI, confidence interval; Se, sensitivity; Sp, specificity; LR+, positive likelihood ratio.

