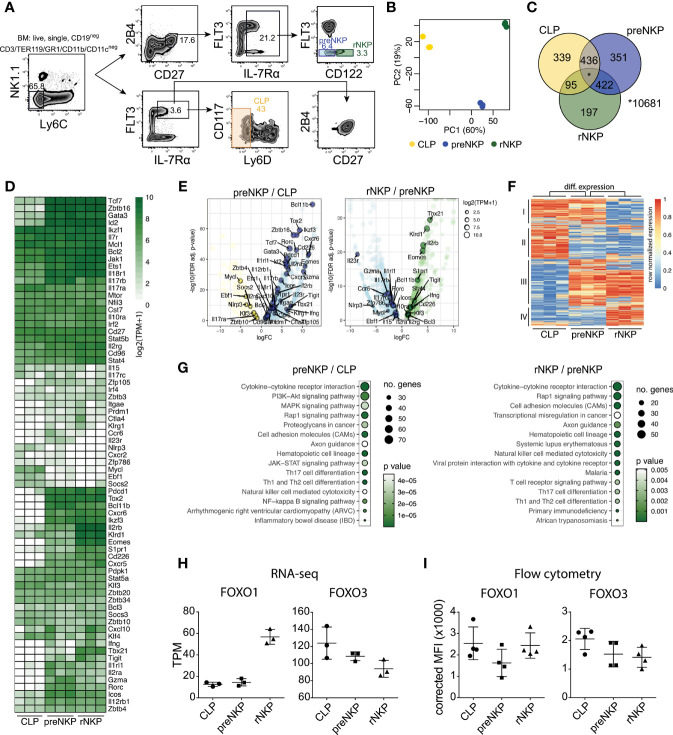
Figure 1.
The rNKP gene expression program is established gradually in the CLP to preNKP and preNKP to rNKP developmental transitions. (A) Gating strategy for FACS sorting of BM NK cell progenitors (LY6Dneg CLP, preNKP and rNKP). (B) Principal component (PC) analysis of RNAseq data from indicated cell populations FACS sorted from WT (FOXO1flox/flox FOXO3flox/flox) mice (n = 3 per population). The variation explained by each PC is displayed in parenthesis. (C) Venn diagram showing the overlap between expressed protein-coding genes in indicated populations. Genes with ≥0.3 transcript per million (TPM) in all three replicas were considered expressed. (D) Hierarchically clustered heatmaps showing expression of protein-coding genes important for NK cell or ILC development. (E) Volcano plots showing differentially expressed genes for the comparisons between preNKP versus CLP (left panel) and rNKP versus preNKP (right panel). Differentially expressed genes (regulated by ≥2-fold at an FDR<0.05) are highlighted in color. Circle sizes indicate expression values in log2(TPM+1). (F) Hierarchically clustered heatmap showing row normalized expression of differential expressed genes (identified in E). Clusters I-IV are indicated. (G) KEGG pathway analysis of differentially expressed genes comparing preNKP versus CLP (left) and rNKP versus preNKP (right). Genes regulated by ≥2-fold at an FDR<0.05 were considered differentially expressed and used in the analysis. The size and color of the circles indicate the number of genes in each category and significance of enrichment respectively. (H–I) Expression levels of FOXO1 and FOXO3 from indicated progenitor populations, obtained by (H) RNA-seq or (I) flow cytometry. Dots represent individual analysed animals (n = 2-4). Bars indicate mean and SD. Data shown in (I) is from one representative experiment out of two independent experiments.

