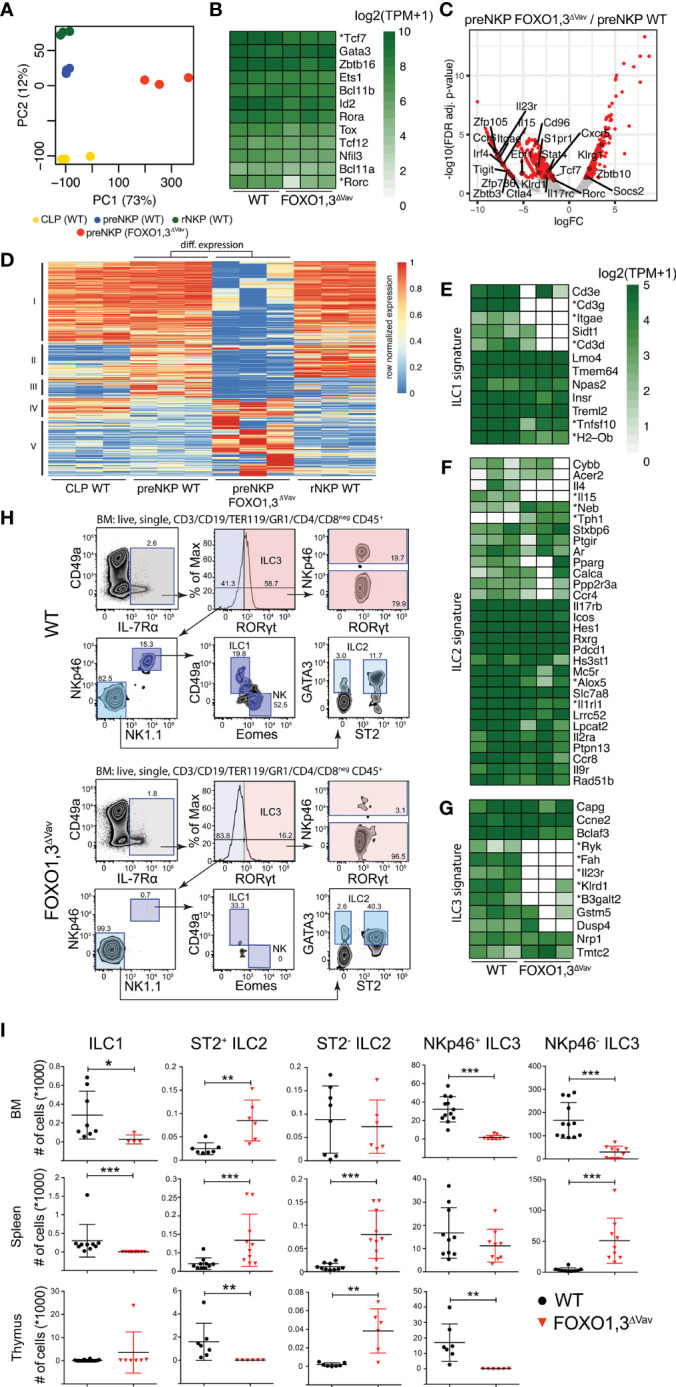
Figure 6.

Loss of FOXO results in a perturbation of the preNKP transcriptional program and the development of non-cytotoxic ILCs. (A) Principal component (PC) analysis of RNAseq data from indicated cell populations (for gating strategy see Figure 1A ) from wildtype and FOXO1,3ΔVav mice (n = 3). The variation explained by each PC is displayed in parenthesis. (B) Hierarchically clustered heatmaps showing gene expression for selected transcription factors critical for NK/ILC development. * indicates significant differences in expression between WT and FOXO1,3ΔVav preNKPs (FDR < 0.05, >2-fold change). (C) Volcano plot showing log2 fold change and adjusted p-value for the comparison of WT to FOXO1,3ΔVav preNKPs. Red dots indicate genes with >2-fold change in expression and adjusted p-value < 0.05. (D) Hierarchically clustered heatmap showing row normalized expression of differential expressed genes (identified in C). Clusters I-V are indicated. (E–G) Hierarchically clustered heatmaps showing gene expression of (E) ILC1, (F) ILC2 and (G) ILC3 signature genes defined by Robinette et al. (64), * indicates significant differences in expression between WT and FOXO1,3ΔVav preNKP (FDR < 0.05, >2-fold change). (H) Representative flow cytometry profiles showing the identification of ILC subsets in BM from WT and FOXO1,3ΔVav mice. (I) Total number of indicated ILC subsets in BM, spleen and thymus from WT and FOXO1,3ΔVav mice (n = 6-12). NKp46- ILC3 population had less than 50 cells per thymus in all mice from both mouse strains so was not shown. Dots represent individual analyzed animals. Bars indicate mean and SD. P-values were calculated using Mann-Whitney tests with *, ** and *** indicates p-values <0.05, <0.01 and <0.001 respectively.
