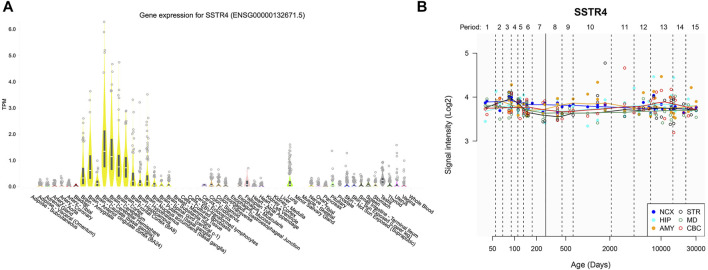
FIGURE 4.
Gene expression of SSTR4 by GTEx and HBT. (A) Spatial expression pattern of the SSTR4 gene in human brain regions from GTEx. TPM = transcripts per kilobase million. Expression threshold: >0.1 TPM and ≥6 reads in 20% or more of samples. Box plots are shown as median and 25th and 75th percentiles; points are displayed as outliers if they are above or below 1.5 times the interquartile ranges. Data Source: GTEx Analysis Release V8 (dbGaP Accession phs000424. v8. p2). (B) Dynamic expression pattern of the SSTR4 gene in 6 human brain regions across lifespan from HBT. NCX, neocortex; CBC, cerebellar cortex; MD, mediodorsal nucleus of the thalamus; STR, striatum; AMY, amygdal; HIP, hippocampus. Period 1, Embryonic development; Period 2, Early fetal development; Period 3, Early fetal development; Period 4, Early mid-fetal development; Period 5, Early mid-fetal development; Period 6, Late mid-fetal development; Period 7, Late fetal development; Period 8, Neonatal and early infancy; Period 9, Late infancy; Period 10, Early childhood; Period 11, Middle and late childhood; Period 12, Adolescence; Period 13, Young adulthood; Period 14, Middle adulthood; Period 15, Late adulthood.

