TABLE 8.
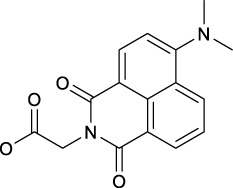
Chemical structures of complexes 81–94 and IC50 values of complexes toward different cell lines.
| Complex | R1 | R2 | λmax/nm of the LMCT band (N3→Pt) | λirr/nm | Cell line | IC50 (light)/μM | IC50 (dark)/μM | PI IC50 (dark)/IC50 (light) | Reference | |
|---|---|---|---|---|---|---|---|---|---|---|

|
81 |

|
OH | 260 | 465 | A2780 | 11.7 ± 0.3 | >100 | >8.5 | Shi et al. (2020b) |
| A549 | 13.3 ± 0.7 | >100 | >7.5 | |||||||
| PC3 | 21.1 ± 0.4 | >100 | >4.7 | |||||||
| MRC5 | — | >100 | — | |||||||
| 82 |
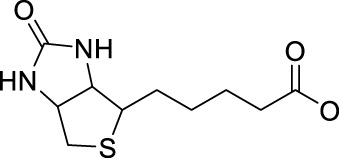
|

|
308 | 465 | A2780 | 1.3 ± 0.2 | >50 | >38.5 | — | |
| A549 | 5.9 ± 0.6 | >100 | >16.9 | |||||||
| PC3 | 3.0 ± 0.1 | >100 | >33.3 | |||||||
| MRC5 | — | >100 | — | |||||||
| 83 | OH |

|
298 | 465 | A2780 | 2.9 ± 0.2 | >100 | >34 | Shi et al. (2020a) | |
| A549 | 7.8 ± 0.1 | >100 | >12 | |||||||
| MRC5 | — | >100 | — | |||||||
| 84 | OH |

|
297 | 465 | A2780 | 0.92 ± 0.07 | >100 | >108 | — | |
| A549 | 5.44 ± 0.05 | >100 | >18 | |||||||
| MRC5 | — | >100 | — | |||||||
| 85 | OH |

|
299 | 465 | A2780 | 1.2 ± 0.2 | >100 | >83 | — | |
| A549 | 6.6 ± 1.1 | >100 | >15 | |||||||
| MRC5 | — | >100 | — | |||||||
| 86 |

|

|
306 | 465 | A2780 | 0.11 ± 0.02 | 1.9 ± 0.1 | 17.3 | ||
| A549 | 2.6 ± 0.3 | >50 | >19 | |||||||
| MRC5 | — | >50 | — | |||||||
| 87 |

|

|
313 | 465 | A2780 | 0.15 ± 0.01 | 1.3 ± 0.2 | 8.7 | ||
| A549 | 1.2 ± 0.1 | >20 | >16 | |||||||
| MRC5 | — | >20 | — | |||||||
| 88 |

|

|
319 | 465 | A2780 | 0.39 ± 0.01 | 1.9 ± 0.3 | 4.9 | ||
| A549 | 1.9 ± 0.1 | >20 | >10 | |||||||
| MRC5 | — | >20 | — | |||||||
| 89 |

|
OH | Around 300 | 420 | A2780 | 2.7 | >132.3 | >49 | Shaili et al. (2021) | |
| A2780cis | 5.4 | >199.8 | >37 | |||||||
| OE19 | 8.2 | >172.2 | >21 | |||||||
| SK-MEL-28 | 15.5 | 175.2 | 11.3 | |||||||
| DU-145 | 20.0 | 176.0 | 8.8 | |||||||
| 90 |
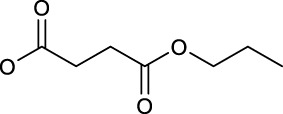
|
OH | Around 300 | 420 | A2780 | 3.7 | >162.8 | >44 | Shaili et al. (2021) | |
| A2780cis | 4.0 | >164.0 | >41 | |||||||
| OE19 | 10.3 | >154.5 | >15 | |||||||
| 91 |

|
OH | Around 300 | 420 | A2780 | 13.4 | >26.8 | >2 | ||
| A2780cis | 13.0 | >26.0 | >2 | |||||||
| OE19 | 17.5 | >33.3 | >1.9 | |||||||
| 92 |

|
OH | 306 | — | — | — | — | — | — | |
| 93 |
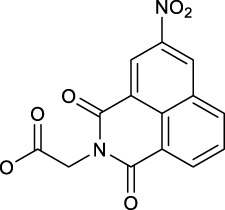
|
OH | 279 | 465 | A549 | 11.8 ± 0.1 | >50 | >4.2 | — | |
| PC3 | 6.4 ± 0.7 | >50 | >7.5 | |||||||
| 94 |
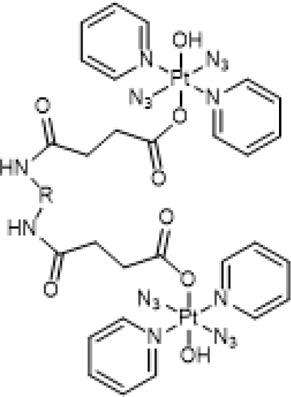
|
OH | 296 | 465 | A549 | 13.5 ± 1.3 | >100 | >7.4 | — | |
| PC3 | 10.1 ± 0.2 | >100 | >9.9 | |||||||
| A2780 | 1.2 ± 0.1 | >100 | >83.3 | |||||||
| 520 | A549 | 92.8 ± 13.5 | >100 | >1.1 | ||||||
| PC3 | 32.7 ± 0.5 | >100 | >3.1 | |||||||
| A2780 | 35.3 ± 2.2 | >100 | >2.8 | |||||||
|
95 |

|
— | Around 300 | 465 | A2780 | 77.0 ± 2.9 | >100 | >1.3 | Shi et al. (2018) |
| A2780cis | 29.5 ± 11.0 | >100 | >3.4 | |||||||
| OE19 | 36.2 ± 2.4 | 41.3 ± 3.2 | 1.1 | |||||||
| MRC5 | >100 | >100 | — | |||||||
| 96 |

|
— | Around 300 | 465 | A2780 | 33.9 ± 5.2 | >100 | >2.9 | — | |
| Around 300 | 465 | A2780cis | 67.6 ± 15.7 | >100 | >1.5 | |||||
| Around 300 | 465 | OE19 | 27.5 ± 5.1 | 49.8 ± 1.5 | 1.8 | |||||
| Around 300 | 465 | MRC5 | >100 | >100 | — | |||||
| 97 |

|
— | Around 300 | 465 | A2780 | 78.3 ± 6.8 | >100 | >1.3 | — | |
| Around 300 | 465 | A2780cis | 35.5 ± 3.4 | >100 | >2.8 | |||||
| Around 300 | 465 | OE19 | 43.71.9 | 53.4 ± 0.4 | 1.2 | |||||
| Around 300 | 465 | MRC5 | >100 | >100 | — | |||||
| 98 |

|
— | Around 300 | 465 | A2780 | 16.73.3 | >100 | >6.0 | — | |
| A2780cis | 17.0 ± 2.3 | >100 | >5.8 | |||||||
| OE19 | 8.8 ± 0.9 | 97.0 ± 5.7 | 11.0 | |||||||
| MRC5 | >100 | >100 | — |
The bold values represent the numbering of the complexes.
