
Figure 1.
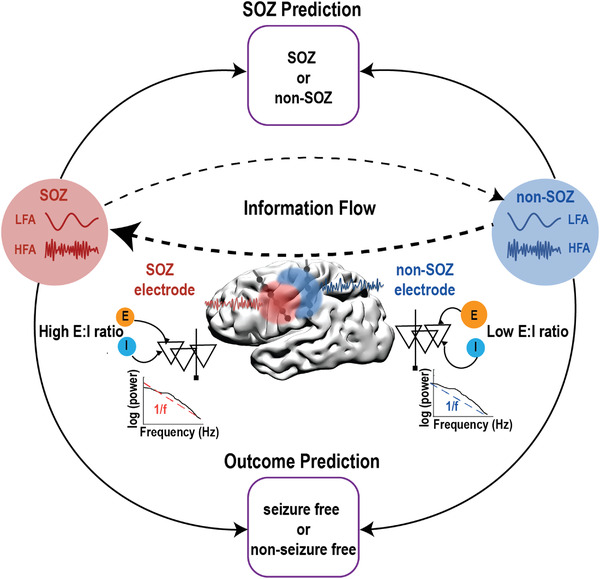
Schematic illustration of the study design. Within‐frequency and cross‐frequency directional connectivity (indication of information flow), 1/f power slope (indication of excitation and inhibition ratio) were investigated in the SEEG resting state data to predict SOZ and seizure outcome. LFA: low‐frequency activity; HFA: high‐frequency activity; SOZ: seizure‐onset zone; E:I: excitation:inhibition.