
Figure 2.
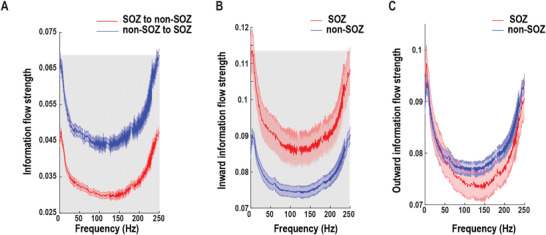
Within‐frequency information flow during the resting state. A) Mean bidirectional information flows between SOZ and non‐SOZ across all electrode pairs and patients. The shaded gray area indicates significant differences at the p = 0.01 level after multiple corrections. B) Inward (receiving) information flow strength in SOZ and non‐SOZ. The shaded gray area indicates significant differences at the p = 0.01 level after multiple corrections. C) Outward (sending) information flow strength in SOZ and non‐SOZ. Data are shown in mean and standard error.