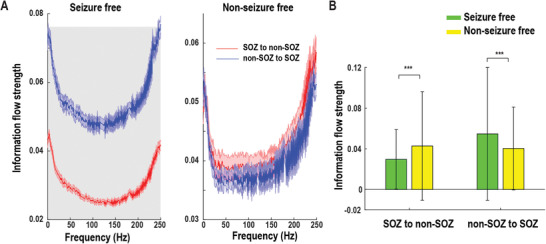
Figure 5.

Association of resting‐state information flow with post‐seizure outcome. A) Within‐frequency information flow between SOZ and non‐SOZ according to seizure outcome. The shaded gray area indicates significant difference at the p = 0.05 level after FDR correction. Data are shown in mean and standard error. B) Averaged bidirectional within‐frequency information flow between SOZ and non‐SOZ over the broadband frequencies in (A). SOZ to non‐SOZ information flow strength was significantly weaker, but non‐SOZ to SOZ information flow strength was substantially stronger in seizure‐free than nonseizure free patients. Error bar represents standard deviation. ***p < 0.001.
