
Figure 1.
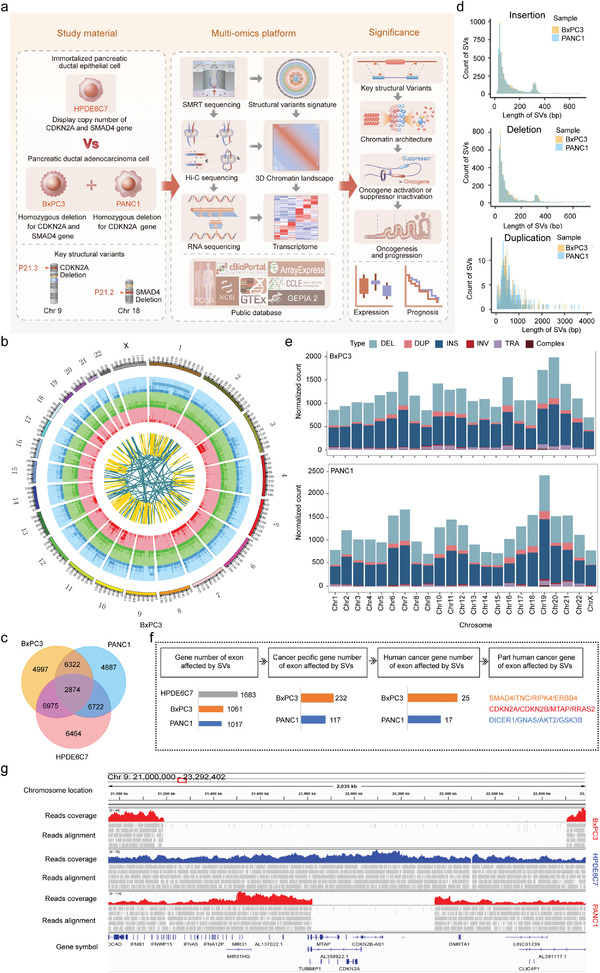
The overall landscape of SVs in PANC1, BxPC3, and HPDE6C7. a) Schematic diagram of the overall research design with the study material, multiomics platform, and significance presented. b) Circos plot showing the high‐confidence SVs detected by Sniffles in BxPC3 with 23 chromosomes inputted. The tracks from the outer to the inner circles are the chromosome coordinates, deletions, insertions, duplications, inversions, and translocations. c) Venn diagram showing the intersection of structural variations in two cancer cell lines (PANC1 and BxPC3) and one normal pancreatic ductal epithelial cell line (HPDE6C7) with counts indicated. d) Histograms showing the length distribution of specific SVs. e) Distribution of standardized total SV burden (deletion: light blue, duplication: pink, insertion: deep blue, inversion: red, translocation: light purple, complex: brown) across chromosomes. f) Pipeline of identification of specific cancer‐related genes directly affected by SVs in exonic regions in PANC1 and BxPC3. g) IGV image showing a homozygous deletion on chromosome 9 (covering CDKN2A, CDKN2B, and MTAP) of different lengths in BxPC3 and PANC1.