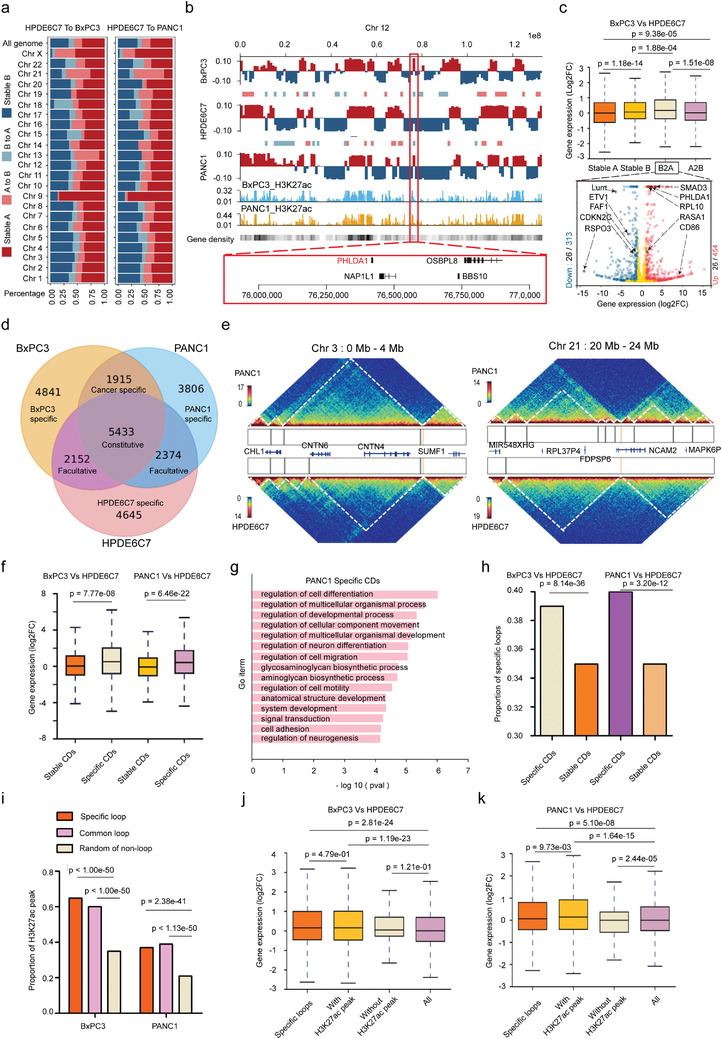
Figure 2.

3D chromatin architecture remodeling correlates with gene expression changes in human PDAC. a) Compartment A/B switching of whole chromosomes in PANC1 and BxPC3 compared with HPDE6C7. Assignment of the A compartment (deep red) and B compartment (deep blue) was performed using eigenvalues > 0 and < 0, respectively. b) Examples of A/B compartment shifts on chromosome 12 in PANC1 and BxPC3 compared with HPDE6C7. Roadmap epigenome enhancer activity, marked by H3K27ac signal peaks, in PANC1 and BxPC3 is shown as blue and brown in histograms. Columns show the gene density in the genome. A red frame denotes a common B‐to‐A in both cancer cell lines covering the PHLDA1 gene. c) Top: Box plots showing the comparison of gene expression levels in different compartments between BxPC3 and HPDE6C7. The box represents the interquartile range (IQR), the centerline denotes the median, and the whiskers extend to 1.5 times the IQR (or to the maximum/minimum if < 1.5 × IQR). Bottom: Volcano plots showing the number of differentially expressed genes (blue) and cancer‐related genes (black) among them in the B‐to‐A shift region. Genes indicated by the black arrow are examples of significantly upregulated (red on the right) or downregulated (blue on the left) cancer‐related genes (|Log2FC|>1 and adjusted p value < 0.05). Gene expression was compared as Log2FC (BxPC3/HPDE6C7) with the p‐value obtained by the Wilcoxon rank‐sum test. d) Venn diagram showing the intersection of CDBs obtained from the interaction matrices at 10 kb resolution in the three cell types with counts indicated. e) Examples of CD alterations in regions of interest (left chr 3: 0–4 Mb, right chr 21: 20–24 Mb) in PANC1 compared with HPDE6C7. The vertical bars in the box between heatmaps represent CDBs. Genes involved in the region are indicated. f) Box plots showing gene expression levels in different types of CDs in BXPC3 and PANC1 compared with HPDE6C7. The box represents the IQR, the centerline denotes the median, and the whiskers extend to 1.5 times the IQR (or to the maximum/minimum if < 1.5 × IQR). Gene expression was compared as Log2FC (cancer cell line/HPDE6C7) with the p‐value obtained by the Wilcoxon rank‐sum test. g) Biological process enrichment of differentially expressed genes located in specific CDs of PANC1. p‐Values were obtained by Fisher's exact test using EnrichR. h) Histograms representing proportions of specific loops in different types of CDs in BxPC3 and PANC1 compared with HPDE6C7. p‐Values were calculated by chi‐square test. i) Histograms represent the proportions of H3K27ac peaks in different types of loops in the genomes of BxPC3 and PANC1. p‐Values were calculated by chi‐square tests. j,k) Box plots represent the gene expression level in specific loops with or without H3K27ac peaks comparing BXPC3 and PANC1 with HPDE6C7. The box represents the IQR, the centerline denotes the median, and the whiskers extend to 1.5 times the IQR (or to the maximum/minimum if < 1.5 × IQR). Gene expression was compared as Log2FC (cancer cell line/HPDE6C7) with the p‐value obtained by the Wilcoxon rank‐sum test.
