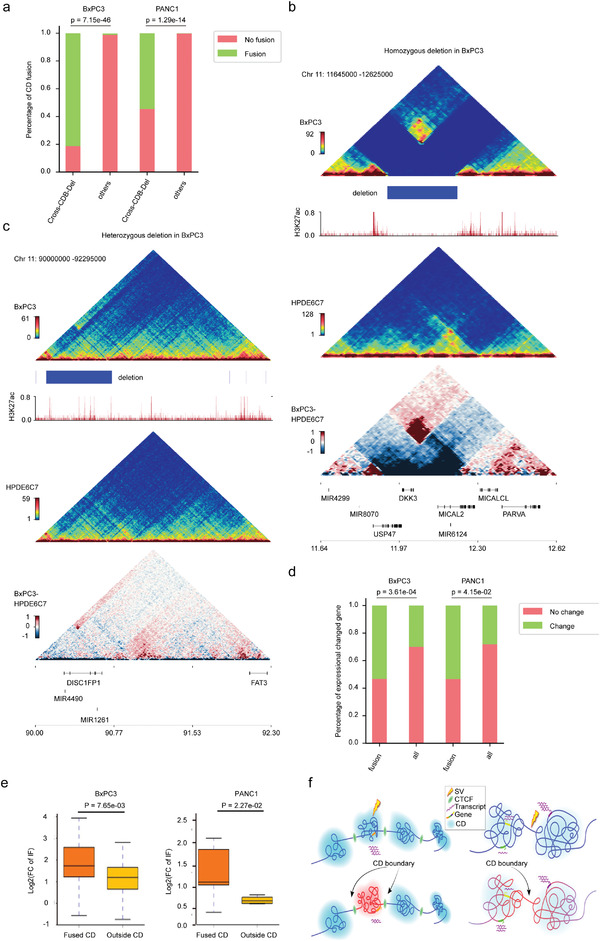
Figure 4.

Cancer‐specific SVs affect gene regulation via reshaping CDs in PDAC genomes. a) Proportion of CD fusions in cross‐CDB deletion fields and other genome regions in BXPC3 and PANC1. p‐Values were calculated by Fisher's exact test. b,c) Examples of the impact of cross‐CDB deletion frequency on the chromatin folding domain in BXPC3. Triangle heatmaps represent chromatin contact frequency, with the top showing BxPC3, middle showing HPDE6C7, and bottom showing the subtractive results. Histogram representing roadmap epigenome enhancer activity, marked by H3K27ac, in BxPC3 (red). b) Homozygous cross‐CDB deletion is associated with CD fusion. c) No significant enhancement of adjacent CD interactions was observed at heterozygous cross‐CDB deletion. d) Proportion of differentially expressed genes in fused CDs and all genomes of BXPC3 and PANC1. p‐Value was calculated by Fisher's exact test. e) Box plots representing gene expression levels in fused CDs and outside CDs in BxPC3 and PANC1 cells. The box represents the IQR, with the centerline denoting the median; the whiskers extend to 1.5 times the IQR (or to the maximum/minimum if < 1.5 × IQR). Gene expression was compared as Log2FC (cancer cell line/HPDE6C7) with the p‐value obtained by the Wilcoxon rank‐sum test. f) Schematic diagram of the influence of SVs on gene expression in adjacent CDs. Left panel: The SV occurs within the CD, and the impact on gene regulation is generally restricted to this CD. Right panel: The SV occurs at a CD boundary or where CD structures are more loosely defined, and the effect on gene regulation spreads to adjacent CDs.
