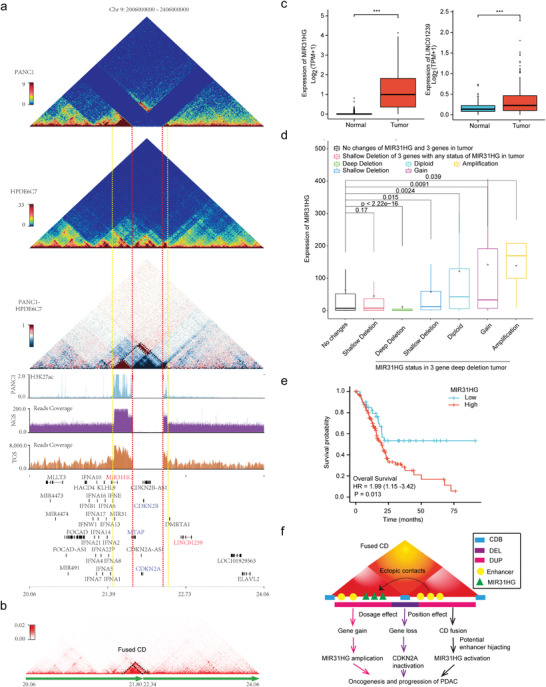
Figure 5.

CDKN2A homozygous deletion is associated with MIR31HG upregulation partly through concomitant adjacent genome amplification and CD fusion. a) Diagram showing the impacts of CDKN2A homozygous deletion and concomitant amplification on 3D chromatin folding domains in PANC1. Triangle heatmaps represent chromatin contact frequency, with the top showing PANC1, middle showing HPDE6C7, and bottom showing the subtractive results. The histograms below represent the roadmap epigenome enhancer activity, marked by H3K27ac, in PANC1 (blue at top) and read coverage of next‐generation (purple at middle) and third‐generation (brown at bottom) sequencing for PANC1 in the same genomic region. The red dashed line denotes the breakpoints of the homozygous deletion, and the yellow dashed line marks the boundaries of the fused CD. The black dashed line in the bottom triangle heatmap indicates the enhanced internal and external interaction of the adjacent CD. b) Triangle heatmap showing the fused CDs with the black dashed line indicated. c) Expression of MIR31HG and Linc01239 in pancreatic cancer and normal control tissues from TCGA and GTEx (n = 350). The box represents the IQR, the centerline denotes the median and the whiskers extend to 1.5 times the IQR (or to the maximum/minimum if < 1.5 × IQR). p‐Values were obtained by Wilcoxon rank‐sum test. ***p ≤ 0.001. d) MIR31HG expression levels under different mutation states of MIR31HG and three genes (CDKN2A, CDKN2B, and MTAP) in pancancer tissues from TCGA. The box represents the IQR, the centerline denotes the median and the whiskers extend to 1.5 times the IQR (or to the maximum/minimum if < 1.5 × IQR). p‐Values were obtained by Kruskal–Wallis test. e) Kaplan–Meier survival curves for overall survival according to MIR31HG expression in the TCGA pancreatic cancer dataset with a total of 178 cases (low group: 43, high group: 135). The p‐value was obtained by Cox regression in R (version 3.6.3). f) Schematic diagram showing that CDKN2A homozygous deletion could promote oncogenesis and the progression of PDAC by upregulating MIR31HG through concomitant amplification (dosage effect) and CD fusion (position effect). Dosage effects include oncogene MIR31HG amplification and suppressor CDKN2A inactivation. Position effects refer to potential enhancer hijacking through CD fusion.
