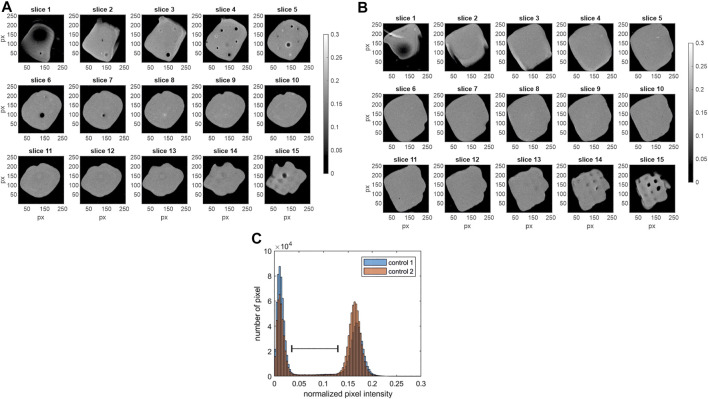
FIGURE 2.
MRI data of the control samples. Shown are the grey scale images of the 15 axial slices (z-stack) with slice 1 as bottom and slice 15 as top slice (256 × 256 px). (A) control 1, field of view 12 mm2 × 12 mm2 (B) control 2, field of view 12 mm2 × 12 mm2. (C) Additionally, the histogram of the normalized pixel intensity (including all 15 slices of each MRI data set) is shown for both control samples. Low normalized pixel intensity <0.05 characterizes dark pixels in the images (A,B). High pixel intensities representing the hydrogel areas (0.12 < I < 0.23) are displayed in bright colors. The black spacer visualizes the expected range of pixel intensity, where peaks of the samples containing cells with T 2 contrast agents are expected.

