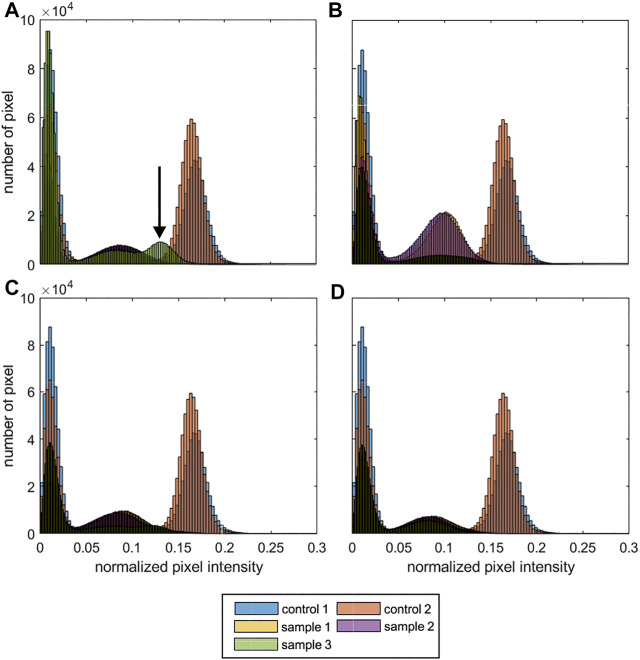
FIGURE 3.
MRI histograms of the process samples. Shown are the histograms of the normalized pixel intensity (including all 15 slices of each MRI data set). For each run 3 objects were produced and analysed. For comparison the control samples 1 + 2 (Figure 2) are shown in each sub-figure. (A) run 1; (B) run 2; (C) run 4; (D) run 4. (nscaffolds, cell = 4 × 3 = 12 cubic scaffolds; nscaffolds, reference = 2 cubic scaffolds) The arrow indicates an anomalous normalized pixel intensity profile.

