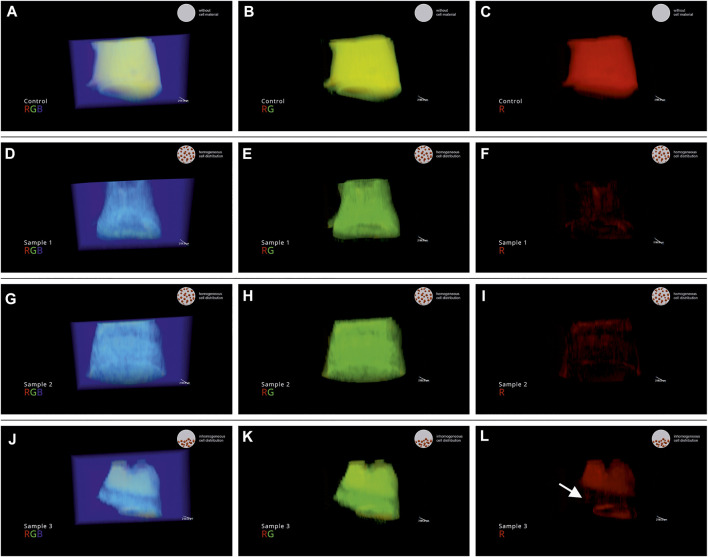
FIGURE 5.
Snap shots of the recorded VR session of the process samples of run 1. (A–C) control 1; (D–F) sample 1 (run 1) (G–I) sample 2 (run 1) (J–L) sample 3 (run 1). In the video, the channels are visualized overlaid and subsequently switched off: displayed channels left) red, green, blue (RGB); middle) red, green (RG); right) red (R).

