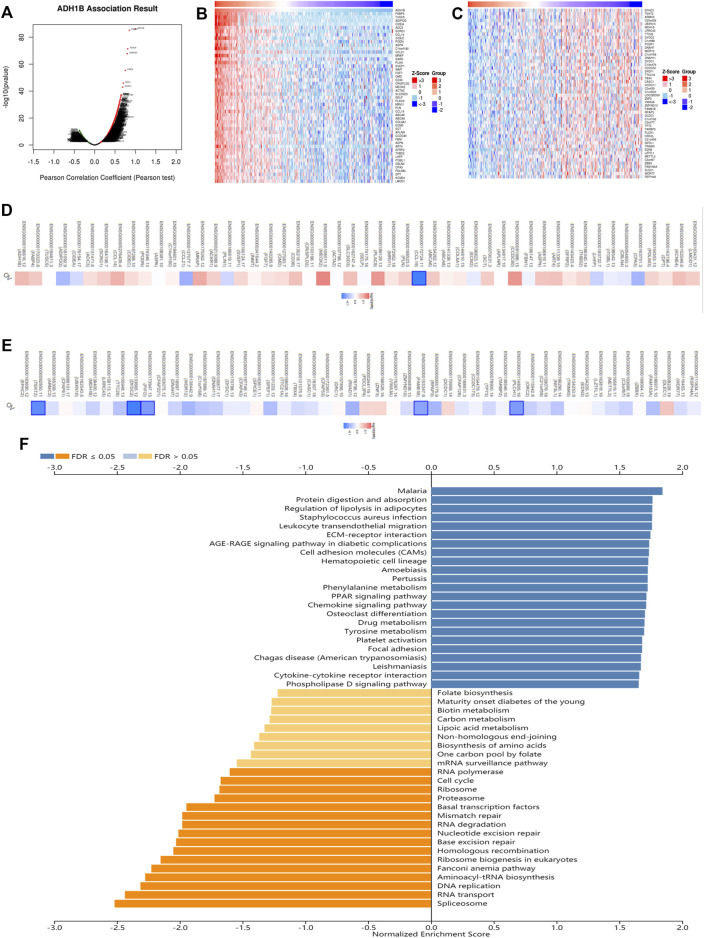
FIGURE 4.
The co-expression analysis of ADH1B in ovarian cancer. (A) The identification of co-expressed genes remarkably related to ADH1B using the LinkedOmics database. (B,C) The top 50 genes positively and negatively in connection with ADH1B were shown on the heat map. Red indicated positive correlations while blue negative. (D,E) The top 50 genes having positive and negative associations with ADH1B were presented on the survival heat map. (F) Bar chart of the KEGG enrichment analysis of ADH1B.

