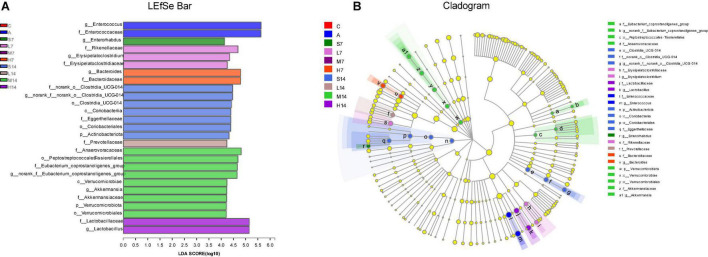
FIGURE 6.
Different analyses of intestinal flora in mice. (A) Bar chart of LDA discrimination result, in which LDA value is > 2.0, and the length of bar chart represents LDA value. (B) LEfSe hierarchical tree diagram of multi-level species, showing the classification of intestinal flora and its main bacterial structure. In the diagram, the circles radiating from inside to outside are phylum, class, order, family, genus, etc. At different classification levels, each small circle represents a classification at that level. The diameter of the small circle is proportional to the relative abundance. Species with significant differences are colored according to groups, whereas those without significant differences are yellow.

