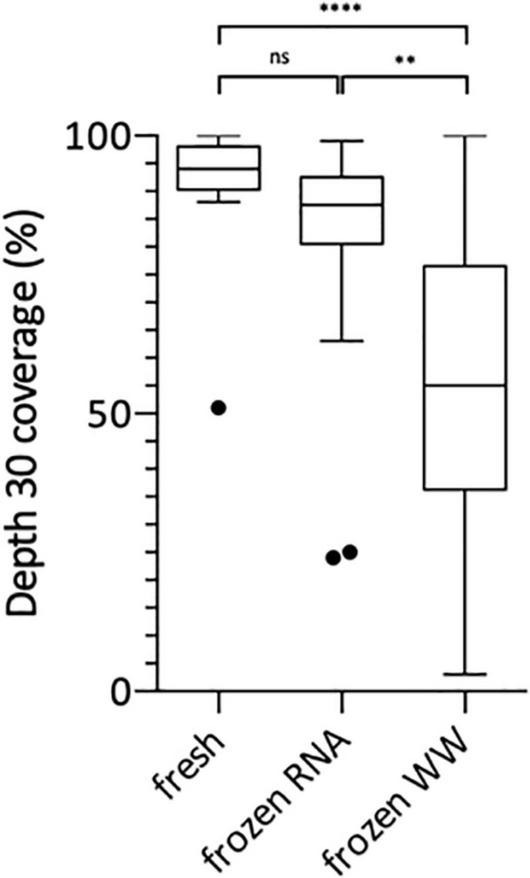
FIGURE 2.

Box Plot of SARS-CoV-2 genome coverage percentages obtained at depth 30 using the previously adapted method and starting from freshly prepared RNA, frozen RNA and frozen wastewater (WW). Kruskal-Wallis test followed by Dunn’s multiple comparisons test were used to compare groups (****p < 0.0001, **p < 0.01, ns: not significant).
