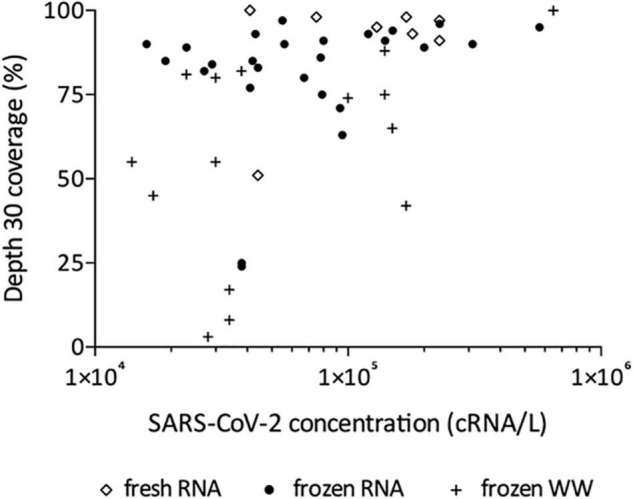
FIGURE 3.

Effect of SARS-CoV-2 concentration on depth 30 genome coverage using the adapted method and starting from freshly prepared RNA, frozen RNA and frozen wastewater (WW). Spearman test was used to test correlation between the two parameters for all samples (p = 0.0004, r = 0.4881) and each group individually: frozen RNA samples (p = 0.0349, r = 0.4153), fresh RNA samples (r = 0.3253, p > 0.05), and frozen WW samples (r = 0.3522, p > 0.05).
