FIGURE 4.
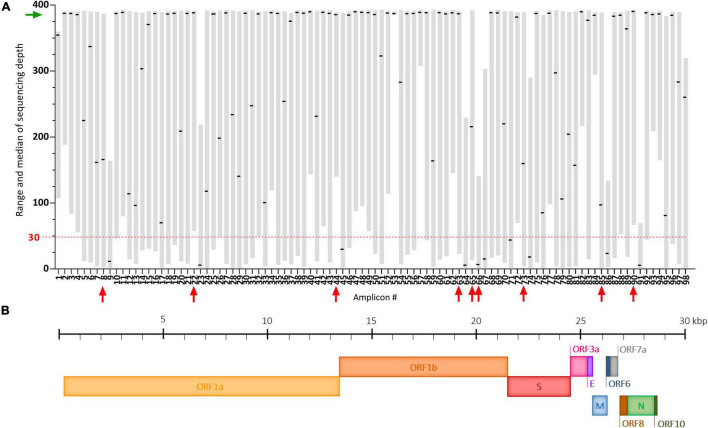
Coverage analysis of the SARS-CoV-2 genome using our adapted ARTIC sequencing protocol. (A) Plot depicting the range (gray floating bars) and medians (black horizontal lines) of sequencing depth obtained for each of the 98 amplicons of the ARTIC multiplex PCR in 35 raw wastewater samples included in the study. Very poorly covered amplicons (median < 30, red dashed line) are indicated by red arrows and the green arrow shows satisfying medians of sequencing depth. (B) Schematic representation of the SARS-CoV-2 genome.

