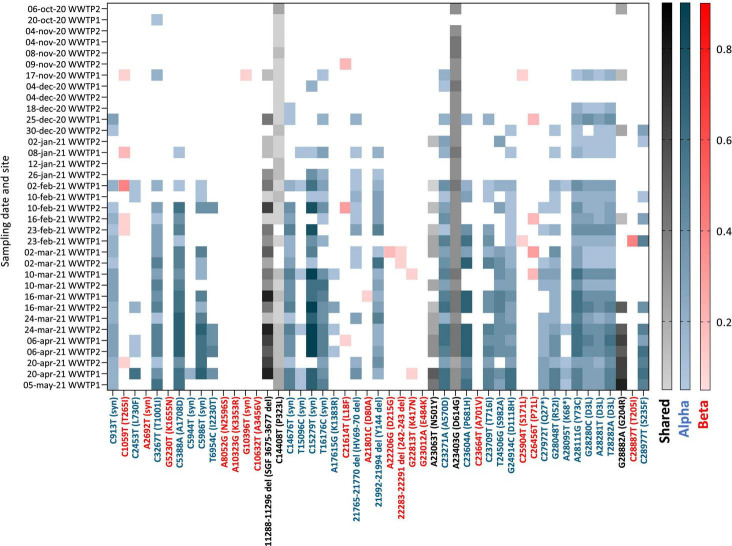
FIGURE 5.
Heatmap of the frequency (color shades) of VOC signature mutations (x axis) in raw wastewater samples collected in 2 WWTP from Nantes overtime (y axis). Blue: Alpha VOC, red: Beta VOC and black: shared mutations. White indicates that no mutation was detected after applying quality filtering and detection thresholds.

