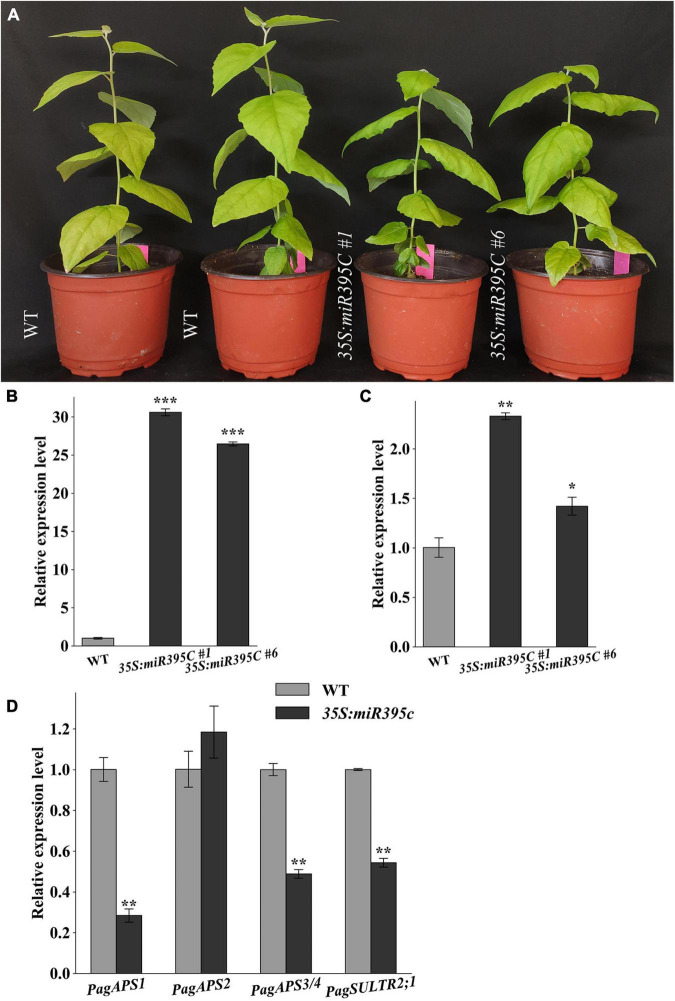
FIGURE 2.
Expression analysis of miR395c and its targets in miR395c-OE poplars. (A) The height of transgenic plants and wild type. (B) The expression of precursor miR395c increased in miR395c-OE poplars. (C) The expression of mature miR395c increased in miR395c-OE poplars. (D) The expression of PagAPS1, PagAPS3/4, and PagSULTR2;1 decreased in the transgenic plants, while the expression of PagAPS2 changed slightly. Asterisks indicate significant difference between transgenic and WT plants using the Student’s t-test, *p < 0.05; **p < 0.01; and ***p < 0.001.

