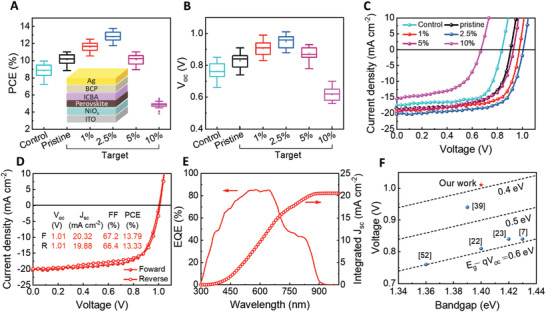
Figure 4.

Device structure and performance. A) PCE statistics of 25 control or target (pristine or containing 1%, 2.5%, 5%, and 10% GuaSCN) PSCs. Inset: the device structure of PSCs. B) V OC statistics of 25 control or target (pristine or containing 1%, 2.5%, 5%, and 10% GuaSCN) PSCs. C) J–V curves of the control or target (pristine or containing 1%, 2.5%, 5%, and 10% GuaSCN) PSCs. D) J–V curves of the champion target‐GuaSCN (2.5%) PSC under different scan directions. E) The EQE spectrum and integrated J SC of the champion target‐GuaSCN (2.5%) PSC. F) V OC loss of Sn‐based PSCs reported in this work and previous literature.
