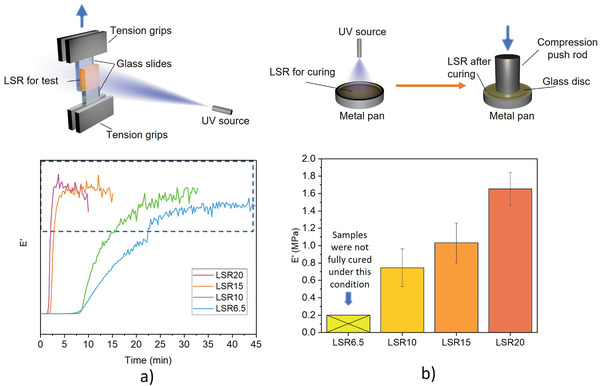
Figure 2.

a) The DMA (tension) results of LSRs between two glass slides exposed to UV. The zig‐zag part of each curve in the dashed region refers to the crack formation and broken of LSR at the end of the test, which could be caused by the heat during UV exposure. The gel time of each curve was determined by crossing the baseline with the tangent line of point on curve that E’ has the highest raising rate. b) The E’ of LSRs after curing by normal UV. The tests were conducted under compression mode. The LSR6.5 cannot be fully cured under the condition used for UV curing test.
