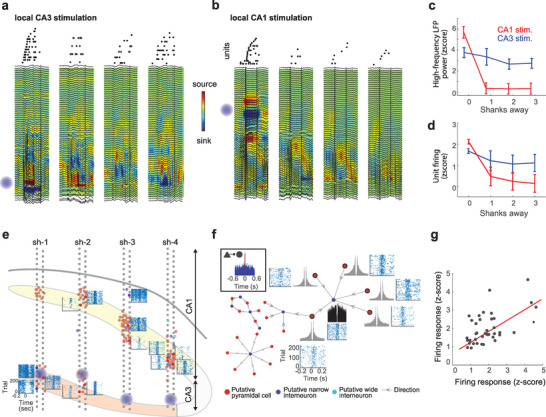
Figure 5.

Unveiling cell type‐specific interactions in the CA3‐CA1 circuit. a) Example response elicited by a 100 ms single μLED activation in the CA3 (blue globe in shank 1). Top: raster plot of spikes shows sequential activation of cells recorded by each shank. Each dot is one spike and each line an individual neuron. Bottom: depth profiles of LFPs superimposed on current source density (CSD) color maps. Note that oscillatory responses as well as unit firing was elicited in the four shanks. b) Same plot as in (a) but in this case the activated μLED was in CA1 (top on shank 1). Strong LFP and unit response was elicited only in shank 1. c) High‐frequency LFP power (80–200 Hz) in CA1 as a function of the horizontal distance from the activated μLED was higher for CA3 than CA1 stimulation (p < 0.001, rank‐sum test, for sites 1–3 shanks away). d) Unit firing response in CA1 was also stronger for CA3 than CA1 simulation for sites 1–3 shanks away of the activated μLED (p < 0.01, rank‐sum test). e) Location of recorded neuron somatas (n = 89 pyramidal cells, 19 narrow‐waveform interneurons and 3 wide‐waveform interneurons, red, dark blue and light blue, respectively) imposed on probe layout (CA1 and CA3 are shown in yellow and orange, respectively). Raster plots show single cell responses to 120 ms light pulses delivered by individual μLEDs in CA3 (blue globes). f) Top left inset: Example functional monosynaptic connection identified from the CCG between a putative pyramidal cell and interneuron. Different functional connectivity motifs from the same session are illustrated with directed graphs (arrows indicate the direction of connection between neurons). Autocorrelation histograms and CA3 optogenetic sequence triggered raster plots are shown for each highlighted neuron. g) Correlation between the firing rate elicited by CA3 stimulation of CA1 cells with mutual monosynaptic connections (r = 0.51, p = 0.0008; n = 50 pairs).
