
Figure 3.
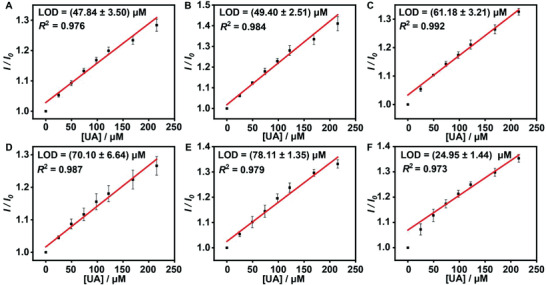
The calibration curves and LOD of UA acquired in the 50‐fold diluted urine from different volunteers (A–F) at 25 °C (n = 3). I 0 and I are the fluorescence intensities of the GC5A·Fl complex (10.00 × 10⁻⁶/5.00 × 10−6 m) before and after addition of UA.