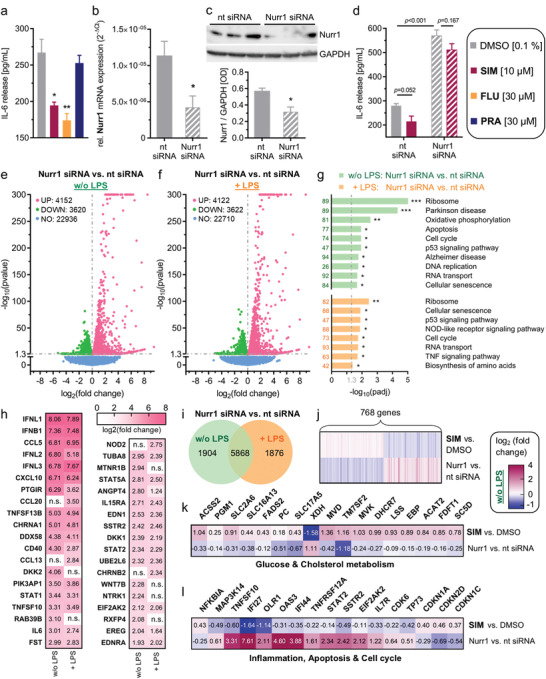
Figure 3.

Nurr1 is involved in neuroinflammatory signaling and Nurr1 silencing causes opposite effects to simvastatin treatment. a) Lipopolysaccharide (LPS)‐treated (1 µg mL−1) T98G cells released considerable amounts of interleukin‐6 (IL‐6). The Nurr1 agonists simvastatin (SIM) and fluvastatin (FLU) significantly counteracted IL‐6 release from LPS‐treated T98G cells, whereas pravastatin (PRA), as negative control, did not affect IL‐6 release. Data are the mean ± S.E.M., n = 4, # p < 0.1, * p < 0.05, ** p < 0.01 (t‐test). b,c) Nurr1 knockdown efficiency as determined by Nurr1 mRNA levels (qRT‐PCR, 2−ΔCt method with GAPDH as reference gene, b) and by western blot (c). Data are the mean ± S.E.M., n = 8 (qRT‐PCR), n = 4 (western blot), * p < 0.05 versus nontargeting (nt) control siRNA (t‐test). d) IL‐6 release from LPS‐treated T98G cells was further enhanced by siRNA‐mediated Nurr1 knockdown suggesting reverse Nurr1 involvement in this inflammatory response. The Nurr1 agonist SIM ameliorated the inflammatory response of T98G cells in a Nurr1‐dependent manner. Data are the mean ± S.E.M., n = 3, p‐values from t‐test. e,f) Differential gene expression in T98G cells treated with nt or Nurr1 siRNA in absence (e) or presence (f) of LPS. Volcano plots show log2fold change in gene expression level (x‐axis) versus statistical significance level (‐log10(p‐value); y‐axis). g) KEGG pathway enrichment analysis illustrates involvement of Nurr1 in signaling pathways related to neurodegenerative diseases and neuroinflammation. Bar plot shows statistical significance level (‐log10(padj)) of regulated KEGG pathways, numbers refer to the count of differentially expressed genes related to the pathway. n = 3, * p < 0.05, ** p < 0.01, *** p < 0.001. h) Selected differentially expressed genes with log2fold change > |2| associated with neurodegenerative diseases (PD, AD, neurodegeneration) or neuroinflammatory signaling (TNF, NFκB, WNT, TGFβ, JAK‐STAT, PI3K‐Akt, apoptosis, neuroactive interaction) according to KEGG are listed with their respective log2fold change values for Nurr1 silencing compared to nt siRNA control in absence or presence of LPS. n.s. – not significant. i) Coexpression Venn diagram for differential gene expression in Nurr1‐silenced cells versus nt siRNA for ± LPS‐treated cells. j–l) 768 genes were oppositely regulated by Nurr1 knockdown or simvastatin treatment in T98G cells (j, Gene list S3, Supporting Information) including several key genes of glucose and cholesterol metabolism (k) as well as inflammation, cell cycle regulation and apoptosis (l). Heatmaps show log2fold change for selected significantly (p < 0.05) regulated genes.
