Figure 4.

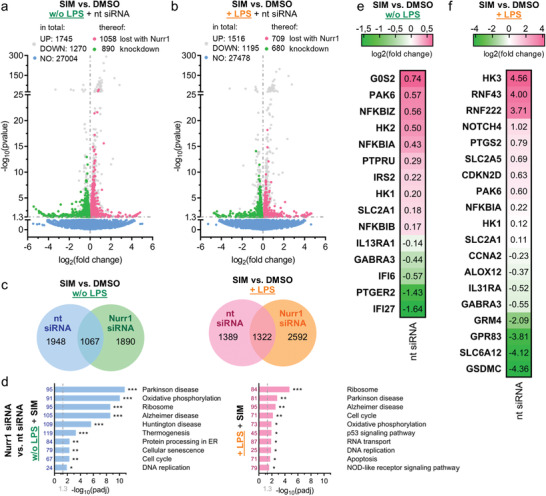
Simvastatin affected gene expression of human astrocytes (T98G) in a Nurr1‐dependent manner. a,b) Differentially expressed genes for simvastatin (SIM, 10 × 10−6 m) versus DMSO treatment in nt siRNA‐treated or Nurr1‐silenced T98G cells without (a) and with (b) additional lipopolysaccharide (LPS)‐stimulation. Genes regulated in nt siRNA‐treated and Nurr1‐silenced cells are gray, genes regulated only in nt siRNA‐treated but not in Nurr1‐silenced cells are red (induction) or green (downregulation). Volcano plots show log2fold change in gene expression level (x‐axis) versus statistical significance level (‐log10(p‐value); y‐axis), n = 3. c) Coexpression Venn diagrams show effects of SIM versus DMSO treatment in nt siRNA‐treated versus Nurr1‐silenced T98G cells with or without additional LPS‐stimulation. d) KEGG pathway enrichment analysis demonstrates effects of Nurr1 activation by SIM on the expression of genes related to cell cycle, apoptosis, oxidative phosphorylation, and thermogenesis as well as the neurodegenerative diseases AD and PD. Bar plot shows statistical significance level (‐log10(padj)) of regulated KEGG pathways, numbers refer to the count of differentially expressed genes related to the pathway. n = 3, * p < 0.05, ** p < 0.01, *** p < 0.001. e,f) Selected genes that were regulated by SIM versus DMSO treatment without (e) or with (f) additional LPS‐stimulation in nt siRNA‐treated cells whose expression was unaffected in Nurr1 siRNA‐treated cells. Only selected genes related to neuroprotection and neuroinflammation are shown, further regulated genes in Tables S1 and S2 of the Supporting Information. Heatmap shows log2fold change in gene expression.
