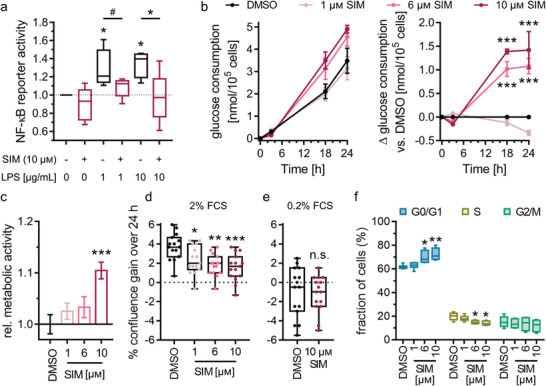
Figure 6.

Simvastatin treatment altered inflammatory response, metabolism, and cell cycle of astrocytes. a) Simvastatin (SIM, 10 × 10−6 m) counteracted lipopolysaccharide (LPS)‐induced NFκB activity in T98G cells overexpressing Nurr1. Boxplots show min.–max. relative activity of an NFκB response element luciferase reporter, n = 4. # p < 0.1, * p < 0.05 (ANOVA). b) SIM enhanced glucose consumption of T98G cells in a dose‐dependent fashion. Graphs show mean ± S.E.M. absolute glucose consumption over time and mean ± S.E.M. Δglucose consumption versus DMSO‐treated cells over time, n = 3. *** p < 0.001 (ANOVA). c) SIM enhanced metabolic activity of T98G cells in a dose‐dependent fashion. Metabolic activity was determined with the WST‐8 reagent. Data are the mean ± S.E.M. relative metabolic activity versus DMSO‐treated cells, n = 15. *** p < 0.001 versus DMSO (ANOVA). d) SIM decreased the fetal calf serum (FCS)‐stimulated (2%) proliferation of T98G cells in a dose‐dependent fashion but had no effect in nonproliferating cells (0.2% FCS, e). Boxplots show min.–max. gain in confluence over 24 h, n = 15. * p < 0.05, ** p < 0.01, *** p < 0.001 versus DMSO‐treated cells (ANOVA). f) Cell cycle analysis of T98G cells treated with 2% FCS and varying concentrations of SIM by flow cytometry. Boxplots show min.–max., n = 6. * p < 0.05, ** p < 0.01 versus DMSO (ANOVA).
