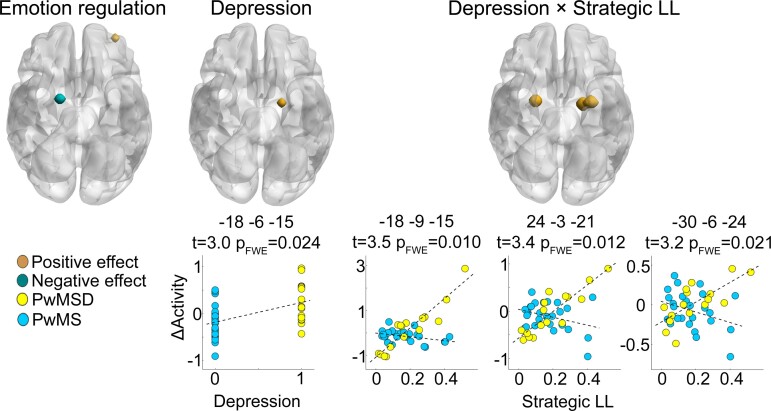
Figure 4.
Regional brain activity. The render brain in the left shows an amygdala area significantly deactivated during negative regulate versus negative permit across all patients (i.e. a main effect of emotion regulation) and a PFC area showing the opposite behaviour. For the amygdala area depicted in the middle render brain, PwMSD are significantly less able to downregulate activity during negative regulate as compared with negative permit than PwMS (main effect of depression). For the peak coordinate in this area, this is also illustrated in the (left) scatter graph below. The right render brain highlights amygdala areas whose differential activity (‘ΔActivity’; i.e. for negative regulate minus negative permit) depends on the interaction between depression and lesions located in amygdala-prefrontal lesions (interaction effect: Depression × Strategic LL). The three scatter graphs below the right render brain illustrate this for the three peak coordinates in these larger areas. The parameters above each scatter graph denote the coordinates of a given peak coordinate in MNI space, the t-statistic and the Type I error rate corrected for family-wise error.

