
Figure 6.
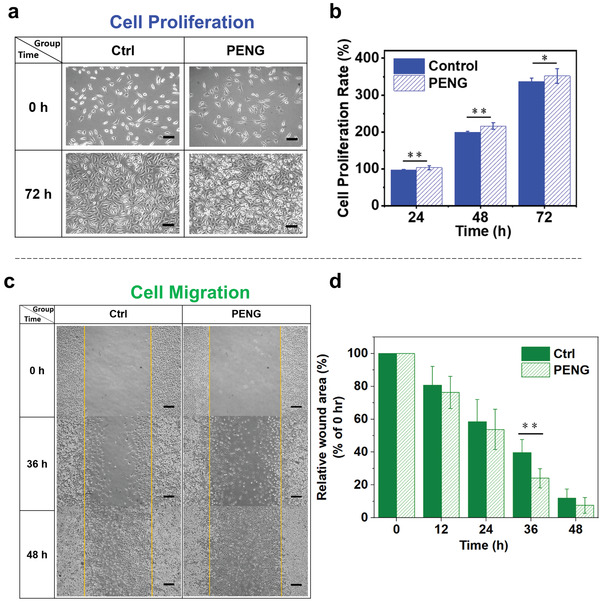
In vitro cellular behaviors of L929 fibroblasts under electrical stimulation by the MN‐PENG. a) Cell morphologies at 0 and 72 h without (control) and with ES from MN‐PENG (PENG). The scale bar is 100 µm. b) Proliferation rates of L929 cells stimulated by the MN‐PENG and control cells at 24, 48, and 72 h (n = 3, *: p < 0.05, and **: p < 0.01). c) Scratched areas of the L929 fibroblasts in control and PENG stimulation groups at 0, 36, and 48 h. The scale bar is 200 µm. d) Quantitative analysis of the migration results (n = 5, *: p < 0.05, and **: p < 0.01).